> ## Documentation Index
> Fetch the complete documentation index at: https://conveo.ai/docs/llms.txt
> Use this file to discover all available pages before exploring further.
# Facets
> What facets are, where they come from, and how to manage them
Interviews produce rich, open-ended conversation. Facets are how Conveo turns that into data you can count, chart, and filter.
## What is a facet?
A **facet** is a dimension of your study: something every interview can be described by. Examples are "Brands mentioned", "Main frustration", "Age group", "Shopping channel". Each facet has a set of **values** ("Coca-Cola", "Pepsi", …), and every completed interview gets coded with the values that fit it.
The easiest way to picture it: one row per participant, one column per facet. In a study about coffee habits, that table might look like this:
| Participant | Age group | Coffee machine type | Brands mentioned |
| ----------- | --------- | -------------------- | -------------------- |
| Amira | 25–34 | Espresso machine | Lavazza, illy |
| Ben | 35–44 | Drip coffee | Starbucks |
| Chloe | 18–24 | Single-serve machine | Nespresso, Starbucks |
| Daan | 45–54 | Moka pot | Lavazza |
| Elif | 25–34 | Drip coffee | Nespresso |
Once an interview carries facet values, you can count it, chart it, filter by it, and cross it with any other facet — "how do brand mentions differ between drip coffee and espresso machine users?" is one facet crossed with another. Every chart you see on the Question coding page is a facet; every filter you apply is a facet condition.
Facets exist at two levels:
* **Question facets** are coded from the answers to one question in your topic guide.
* **Whole-interview facets** are coded from the entire transcript, or come from what you know about the participant (panel demographics, screener answers, uploaded data).
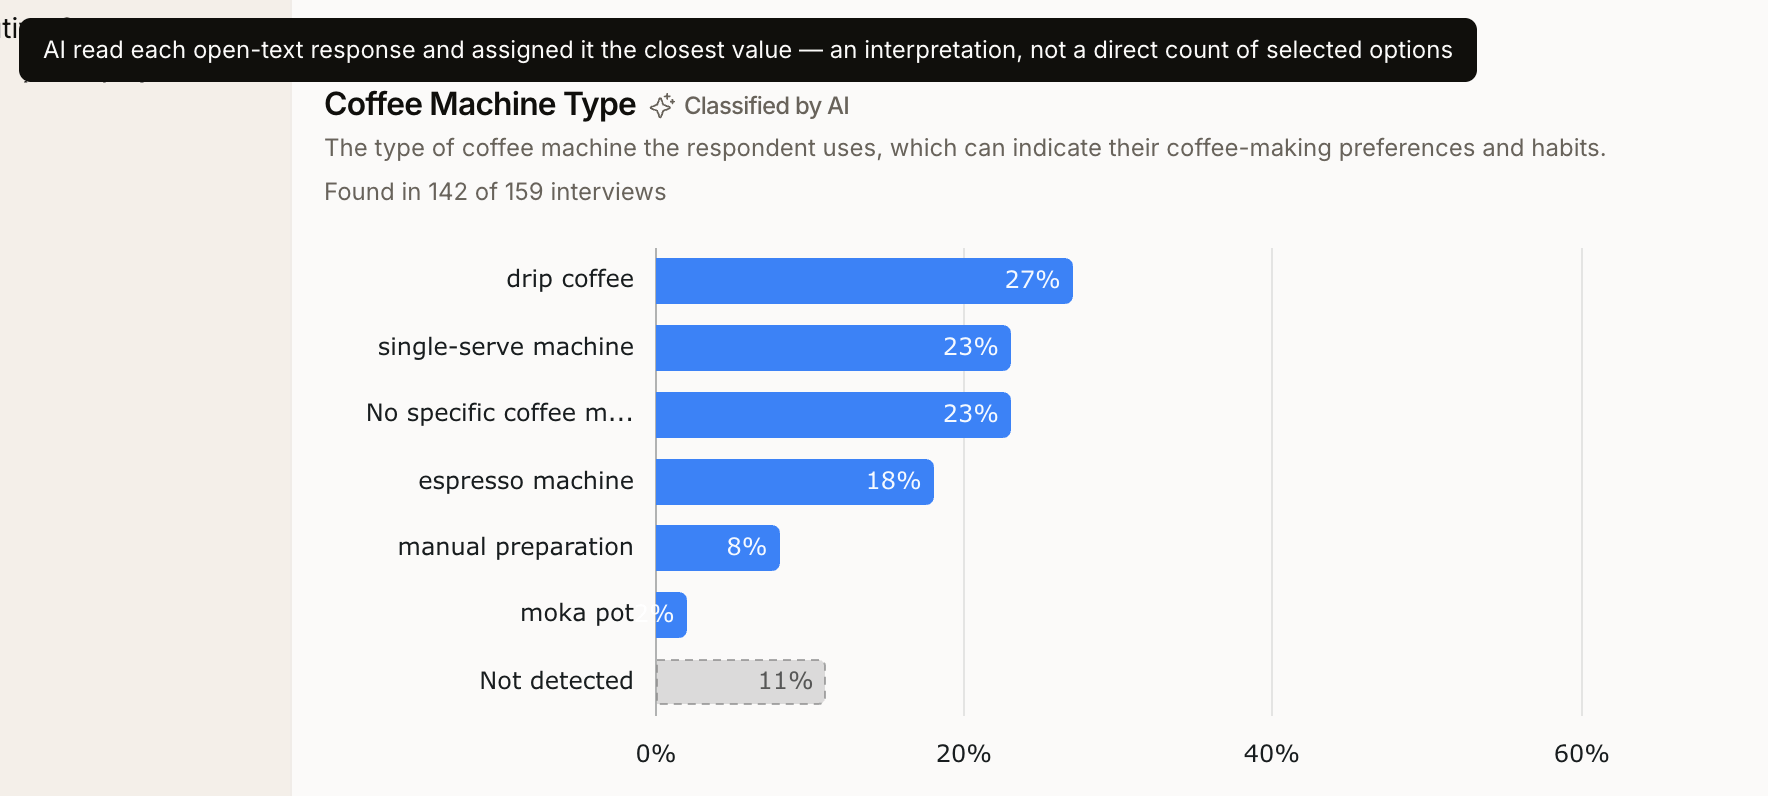
How a facet's numbers were produced is always visible on its chart:
* A check icon means a **direct count** — the participant literally selected that option (single-select and multi-select questions, screener answers, panel data).
* A sparkle icon means **classified by AI** — the AI read each open-text response and assigned it the closest value. An interpretation, not a direct count.
 ## Where facets come from
Most facets are created for you. The Question coding page groups them by origin, so the section headings you see there are also the answer to "where did this facet come from?".
## Where facets come from
Most facets are created for you. The Question coding page groups them by origin, so the section headings you see there are also the answer to "where did this facet come from?".
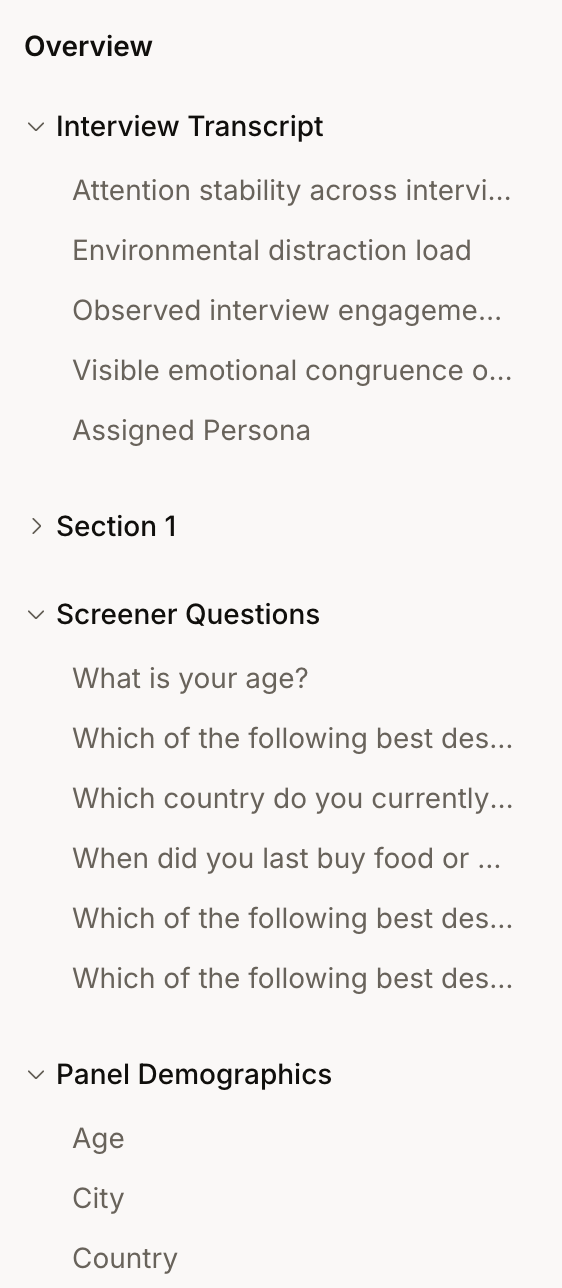 ### Created automatically when your study launches
| Section | What you get |
| -------------------- | -------------------------------------------------------------------------------------------------------------------------------------------------------------------------------------------------------- |
| Question sections | One facet per single-select or multi-select question, with one value per answer option (direct counts). For open-ended questions, the AI suggests facets worth coding based on your research objectives. |
| Interview transcript | Whole-interview facets the AI derives from your briefing and objectives — themes worth tracking across the full conversation, not tied to any single question. |
| Screener questions | One facet per screener question, coded from what participants answered. |
| Random images/videos | If your study randomizes stimuli, a facet records which stimulus each participant saw — so you can split any other result by stimulus. |
### Created from participant data as interviews come in
| Section | What you get |
| -------------- | ---------------------------------------------------------------------------------------------------------------------------------------------------------------------------------------------------------------------------------------------------------------- |
| Panel data | Demographics from your recruitment panel: age, gender, country, and any profiling fields the panel provides. This section also holds the facets Conveo maintains itself: the interview's language, and (for diary studies) which entry number each interview is. |
| Uploaded data | One facet per column of any participant CSV you upload. |
| Quota segments | If your study uses quotas, one facet per quota group records which segment each participant landed in. |
The Panel data section can also contain **derived** facets: facets Conveo sets up to combine data that arrives in different shapes from different panel providers into one canonical dimension: the same demographic coming from two different panels merged into a single facet, like age groups (which can differ from provider to provider).
### Quality measures, maintained by the system
Every study also gets a set of facets that describe each interview itself, computed deterministically rather than coded by AI:
* **Interview duration (min)**: how long the interview took, start to completion.
* **Interview outcome**: completed, abandoned, screened out, canceled, or in progress.
* **Questions answered**: how many questions the participant got through.
* **Response quality score**: an automated 1–10 rating of response quality.
* **Word count**: how much the participant said.
These don't appear as charts on the Question coding page — you'll meet them as columns in the interview grid, as filters, and when you ask about sample quality in the Analyze chat. They're handy for cutting any analysis by engagement: "only interviews longer than 10 minutes", "exclude abandoned interviews".
### Created by you
Three ways to add a facet yourself:
* **From a question**: click "Create facet" below any question on the Question coding page to code a new dimension from that question's answers.
* **From the whole interview**: click "Create facet" in the Interview transcript section to code a dimension from the full conversation.
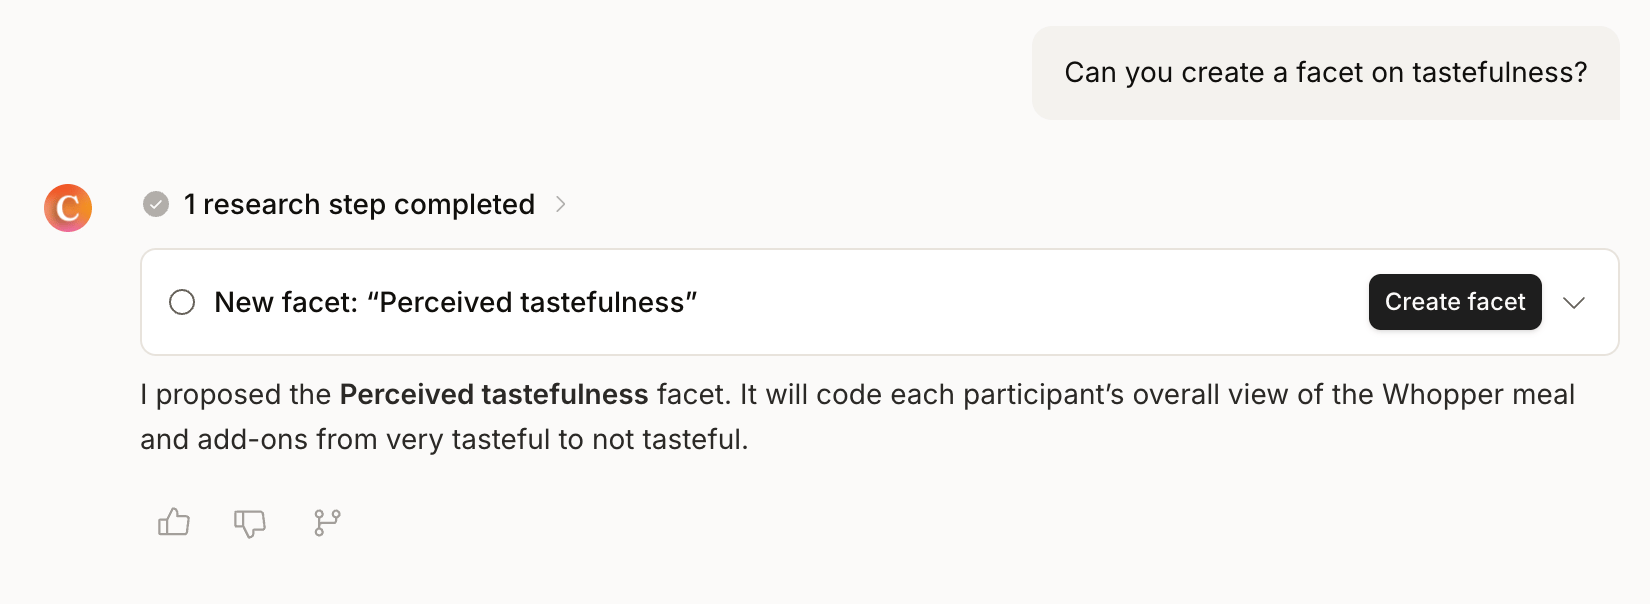
* **From the Analyze chat**: when a question you ask needs structured data that doesn't exist yet, the AI proposes a facet and shows you exactly what it will code. Click "Create facet" on the proposal to accept it. Extraction runs in the background; you can keep working.
### Created automatically when your study launches
| Section | What you get |
| -------------------- | -------------------------------------------------------------------------------------------------------------------------------------------------------------------------------------------------------- |
| Question sections | One facet per single-select or multi-select question, with one value per answer option (direct counts). For open-ended questions, the AI suggests facets worth coding based on your research objectives. |
| Interview transcript | Whole-interview facets the AI derives from your briefing and objectives — themes worth tracking across the full conversation, not tied to any single question. |
| Screener questions | One facet per screener question, coded from what participants answered. |
| Random images/videos | If your study randomizes stimuli, a facet records which stimulus each participant saw — so you can split any other result by stimulus. |
### Created from participant data as interviews come in
| Section | What you get |
| -------------- | ---------------------------------------------------------------------------------------------------------------------------------------------------------------------------------------------------------------------------------------------------------------- |
| Panel data | Demographics from your recruitment panel: age, gender, country, and any profiling fields the panel provides. This section also holds the facets Conveo maintains itself: the interview's language, and (for diary studies) which entry number each interview is. |
| Uploaded data | One facet per column of any participant CSV you upload. |
| Quota segments | If your study uses quotas, one facet per quota group records which segment each participant landed in. |
The Panel data section can also contain **derived** facets: facets Conveo sets up to combine data that arrives in different shapes from different panel providers into one canonical dimension: the same demographic coming from two different panels merged into a single facet, like age groups (which can differ from provider to provider).
### Quality measures, maintained by the system
Every study also gets a set of facets that describe each interview itself, computed deterministically rather than coded by AI:
* **Interview duration (min)**: how long the interview took, start to completion.
* **Interview outcome**: completed, abandoned, screened out, canceled, or in progress.
* **Questions answered**: how many questions the participant got through.
* **Response quality score**: an automated 1–10 rating of response quality.
* **Word count**: how much the participant said.
These don't appear as charts on the Question coding page — you'll meet them as columns in the interview grid, as filters, and when you ask about sample quality in the Analyze chat. They're handy for cutting any analysis by engagement: "only interviews longer than 10 minutes", "exclude abandoned interviews".
### Created by you
Three ways to add a facet yourself:
* **From a question**: click "Create facet" below any question on the Question coding page to code a new dimension from that question's answers.
* **From the whole interview**: click "Create facet" in the Interview transcript section to code a dimension from the full conversation.
* **From the Analyze chat**: when a question you ask needs structured data that doesn't exist yet, the AI proposes a facet and shows you exactly what it will code. Click "Create facet" on the proposal to accept it. Extraction runs in the background; you can keep working.
 ### Kept clean automatically
Conveo periodically reviews a study's facets — around the halfway mark of fieldwork, at study completion, and on every Storyline wave. This pass can discover a new whole-interview facet the corpus supports, merge duplicates, hide redundant ones, and consolidate near-identical values. If a facet appears or two facets become one without you touching anything, this is why. Values you have edited by hand are left alone.
## What happens when you create a facet
Creating a facet is not a one-off query — it adds a standing dimension to your study:
1. **All completed interviews are coded first.** The AI reads every existing interview and assigns each one a value. This runs once, in the background, and may take a few minutes on a large study.
2. **Every future interview is coded automatically** as it completes. The counts keep growing without you doing anything.
So a facet created today is immediately measurable across your whole dataset — past and future. That is what makes facets powerful, and also why a small, deliberate set of facets beats a long list of one-off ones. The next section helps you choose.
## Ask a question or create a facet?
The Analyze chat can answer many quantitative questions on the spot, and will propose a facet when it genuinely needs one. Use this rule of thumb:
| You want to… | Do this |
| ---------------------------------------- | ------------------------------------------------------------------------------- |
| Check a number once | Ask in the Analyze chat. A one-off count or sense check doesn't need a facet. |
| Track, filter, or split by it repeatedly | Create a facet. Filters, charts, crosstabs, and Storyline metrics all need one. |
When you do create facets, three habits keep the set healthy:
* **Make them composable, not combined.** Facets cross with each other for free. A "Market" facet and an "AI tool used" facet already answer "German ChatGPT users" and "Swedish Gemini users" — you never need a facet for the combination itself.
* **Avoid overlap.** Two facets that code nearly the same thing don't double your information; they split it. If a new facet would mostly duplicate an existing one, refine the existing one instead (see [Managing a facet](#managing-a-facet)).
* **Retire what you no longer use.** There is no hard limit on facets, but every active facet is coded on each new interview, and a cluttered facet list makes the useful ones harder to find. Hide a facet to declutter without losing its data, or delete it to remove it permanently.
**A definition will evolve? Edit, don't re-create.** If a facet's meaning shifts — you rename values, tighten what counts — update the existing facet and re-analyze. All interviews, past and future, are recoded to the new definition, and everything built on the facet keeps working. Creating "v2" facets alongside old ones is how facet lists rot.
## Managing a facet
Quick actions live on each facet card's "…" menu on the Question coding page: "Duplicate chart", switching between absolute and percentage values, "Hide chart", and "Delete chart". Hidden facets stay coded and can be brought back with "Show hidden facets"; deleting is permanent.
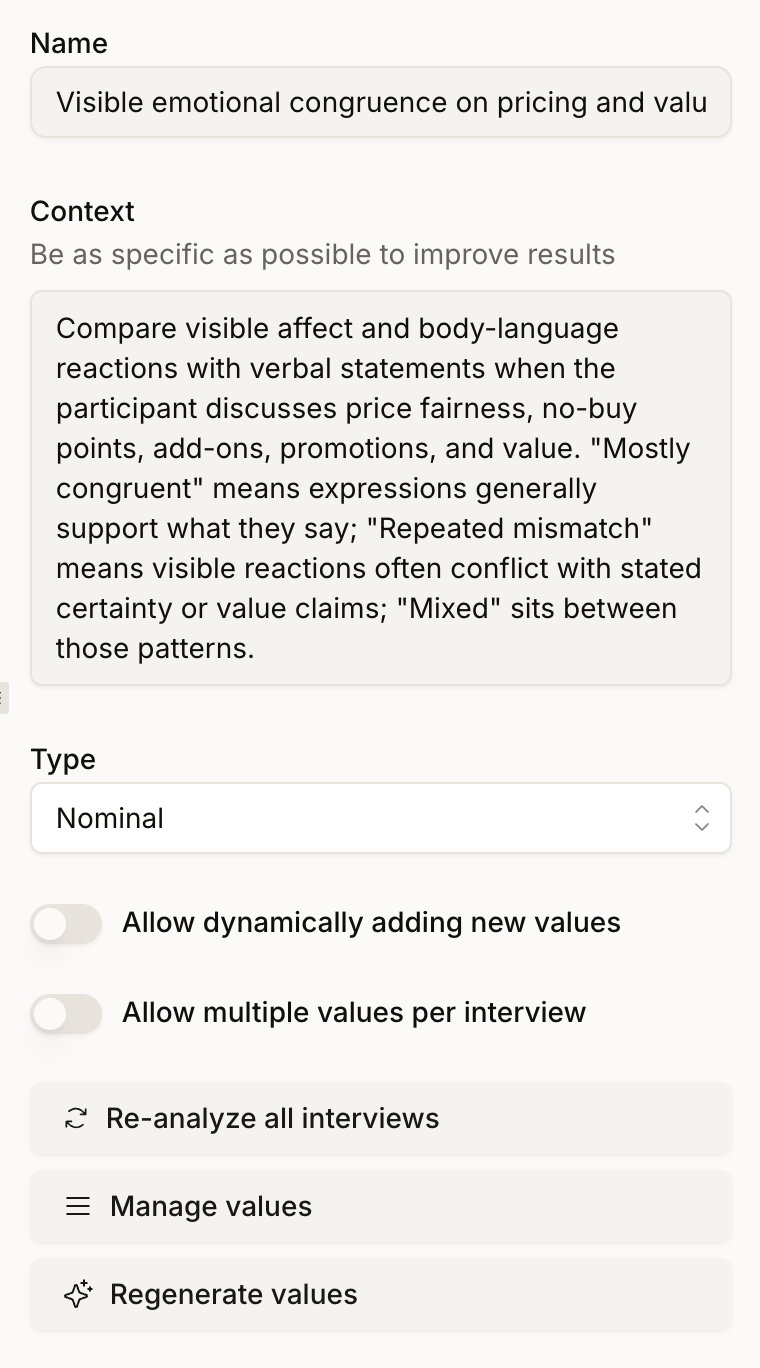
Everything else happens on the facet's detail page — click the facet's name on its card to open it — in the "Edit facet" panel:
| Control | What it does |
| ------------------------- | -------------------------------------------------------------------------------------------------------------------------------------------------------------------------------------------------------- |
| Name and Context | Rename the facet, and refine the instructions the AI uses when coding. Context is the biggest lever on coding quality — be as specific as possible. |
| Type | Nominal (unordered categories), Ordinal (ordered categories, like ratings), or Metric (numbers). |
| Manage values | Add, rename, or remove the facet's values by hand. Renamed values are protected — automated cleanups won't touch them. |
| Regenerate values | Give the AI instructions to consolidate the current values — "merge synonyms", "group into 5 main categories" — and it proposes a cleaner set. |
| Bucket into ranges | For numeric facets: replaces messy values with clean ranges (1–5, 6–10, …) picked from the actual distribution, then recodes every interview. |
| Re-analyze all interviews | Recodes every interview with the current name, context, and values. Run this after any meaningful edit. If you've coded values by hand, you choose "Preserve manual values" or "Override manual values". |
| Value switches | "Allow multiple values per interview" — can one interview carry several values? "Allow dynamically adding new values" — may the AI invent new values as it codes, or is the list closed? |
### Kept clean automatically
Conveo periodically reviews a study's facets — around the halfway mark of fieldwork, at study completion, and on every Storyline wave. This pass can discover a new whole-interview facet the corpus supports, merge duplicates, hide redundant ones, and consolidate near-identical values. If a facet appears or two facets become one without you touching anything, this is why. Values you have edited by hand are left alone.
## What happens when you create a facet
Creating a facet is not a one-off query — it adds a standing dimension to your study:
1. **All completed interviews are coded first.** The AI reads every existing interview and assigns each one a value. This runs once, in the background, and may take a few minutes on a large study.
2. **Every future interview is coded automatically** as it completes. The counts keep growing without you doing anything.
So a facet created today is immediately measurable across your whole dataset — past and future. That is what makes facets powerful, and also why a small, deliberate set of facets beats a long list of one-off ones. The next section helps you choose.
## Ask a question or create a facet?
The Analyze chat can answer many quantitative questions on the spot, and will propose a facet when it genuinely needs one. Use this rule of thumb:
| You want to… | Do this |
| ---------------------------------------- | ------------------------------------------------------------------------------- |
| Check a number once | Ask in the Analyze chat. A one-off count or sense check doesn't need a facet. |
| Track, filter, or split by it repeatedly | Create a facet. Filters, charts, crosstabs, and Storyline metrics all need one. |
When you do create facets, three habits keep the set healthy:
* **Make them composable, not combined.** Facets cross with each other for free. A "Market" facet and an "AI tool used" facet already answer "German ChatGPT users" and "Swedish Gemini users" — you never need a facet for the combination itself.
* **Avoid overlap.** Two facets that code nearly the same thing don't double your information; they split it. If a new facet would mostly duplicate an existing one, refine the existing one instead (see [Managing a facet](#managing-a-facet)).
* **Retire what you no longer use.** There is no hard limit on facets, but every active facet is coded on each new interview, and a cluttered facet list makes the useful ones harder to find. Hide a facet to declutter without losing its data, or delete it to remove it permanently.
**A definition will evolve? Edit, don't re-create.** If a facet's meaning shifts — you rename values, tighten what counts — update the existing facet and re-analyze. All interviews, past and future, are recoded to the new definition, and everything built on the facet keeps working. Creating "v2" facets alongside old ones is how facet lists rot.
## Managing a facet
Quick actions live on each facet card's "…" menu on the Question coding page: "Duplicate chart", switching between absolute and percentage values, "Hide chart", and "Delete chart". Hidden facets stay coded and can be brought back with "Show hidden facets"; deleting is permanent.
Everything else happens on the facet's detail page — click the facet's name on its card to open it — in the "Edit facet" panel:
| Control | What it does |
| ------------------------- | -------------------------------------------------------------------------------------------------------------------------------------------------------------------------------------------------------- |
| Name and Context | Rename the facet, and refine the instructions the AI uses when coding. Context is the biggest lever on coding quality — be as specific as possible. |
| Type | Nominal (unordered categories), Ordinal (ordered categories, like ratings), or Metric (numbers). |
| Manage values | Add, rename, or remove the facet's values by hand. Renamed values are protected — automated cleanups won't touch them. |
| Regenerate values | Give the AI instructions to consolidate the current values — "merge synonyms", "group into 5 main categories" — and it proposes a cleaner set. |
| Bucket into ranges | For numeric facets: replaces messy values with clean ranges (1–5, 6–10, …) picked from the actual distribution, then recodes every interview. |
| Re-analyze all interviews | Recodes every interview with the current name, context, and values. Run this after any meaningful edit. If you've coded values by hand, you choose "Preserve manual values" or "Override manual values". |
| Value switches | "Allow multiple values per interview" — can one interview carry several values? "Allow dynamically adding new values" — may the AI invent new values as it codes, or is the list closed? |
 ### Which facets can be edited?
Facets the AI codes from your interviews — question facets, whole-interview facets, video-analysis facets — are fully editable. Facets that mirror a source of truth are read-only: panel data, screener answers, single/multi-select questions, uploaded CSV columns, quota segments, interview language, and diary entry numbers all reflect what actually happened, so there is nothing to re-interpret. You can still chart, filter, hide, and export them like any other facet.
## Correcting the coding by hand
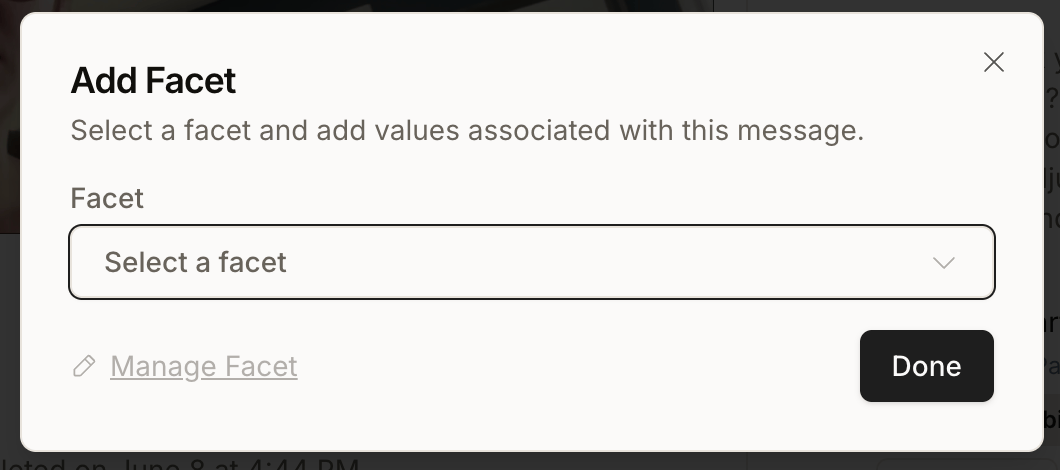
You can override the AI's coding on any individual interview. In a transcript, hover a participant answer and click "Add facet" to attach a facet value to that message, or click an existing facet badge to change it. You can also add a brand-new value on the spot if none of the existing ones fit.
Hand-coded values are marked as manual, count toward the facet's charts like any other value, and survive re-analysis if you choose "Preserve manual values".
### Which facets can be edited?
Facets the AI codes from your interviews — question facets, whole-interview facets, video-analysis facets — are fully editable. Facets that mirror a source of truth are read-only: panel data, screener answers, single/multi-select questions, uploaded CSV columns, quota segments, interview language, and diary entry numbers all reflect what actually happened, so there is nothing to re-interpret. You can still chart, filter, hide, and export them like any other facet.
## Correcting the coding by hand
You can override the AI's coding on any individual interview. In a transcript, hover a participant answer and click "Add facet" to attach a facet value to that message, or click an existing facet badge to change it. You can also add a brand-new value on the spot if none of the existing ones fit.
Hand-coded values are marked as manual, count toward the facet's charts like any other value, and survive re-analysis if you choose "Preserve manual values".
 ## Where facets show up
* **Filters** — every filter on the Question coding page (and saved filter sets) is built from facets.
* **The interview grid** — each facet is a sortable, filterable column.
* **The Analyze chat** — facets are the structured data the AI counts and crosses when you ask quantitative questions.
* **Storylines** — metrics track facet values over waves, and splitting a metric "by region" or "by customer tier" means splitting by a facet.
* **Exports** — the custom CSV export can include all facets as columns, and every facet chart exports to CSV or PNG on its own.
***
**Anything missing?** Let us know at [support@conveo.ai](mailto:support@conveo.ai) and we'll help you out!
## Where facets show up
* **Filters** — every filter on the Question coding page (and saved filter sets) is built from facets.
* **The interview grid** — each facet is a sortable, filterable column.
* **The Analyze chat** — facets are the structured data the AI counts and crosses when you ask quantitative questions.
* **Storylines** — metrics track facet values over waves, and splitting a metric "by region" or "by customer tier" means splitting by a facet.
* **Exports** — the custom CSV export can include all facets as columns, and every facet chart exports to CSV or PNG on its own.
***
**Anything missing?** Let us know at [support@conveo.ai](mailto:support@conveo.ai) and we'll help you out!