In this article
TL;DR
Best for: Insights and CMI professionals who need to move customer touchpoints from a mapping exercise to a prioritization discipline.
Most touchpoint inventories rank by volume: how often a moment occurs, how many customers pass through it. Volume is the wrong axis. Friction compounds across multiple touchpoints, and the moments that most damage customer loyalty or derail a purchase decision are often low-frequency, high-consequence, and invisible until a customer says so.
This article shows how to prioritize customer touchpoints by customer-reported consequence using a three-axis scorecard.
Research-grade qualitative evidence is what separates a defensible priority list from a ranked guess: the highest-confidence score in the framework goes to touchpoints backed by rich verbatim quotes and video, the kind of evidence a survey alone can't produce. AI-moderated video interviews surface the why behind customer behavior that analytics alone cannot explain.
The prioritization framework works as an always-on program: each wave of research updates the scorecard, so touchpoints stay current as the customer journey changes.
Teams that operationalize this approach stop commissioning periodic audits and start maintaining a living picture of where the customer experience breaks down.
Most touchpoint inventories sort customer journey touchpoints by volume: how many customers hit it, how often, and how much customer data it generates. That favors operational visibility over customer consequences: a high-frequency onboarding email, one of many customer communications, outranks a rare renewal conversation that decides customer retention, whether the account stays or leaves.
What teams lack is a way to capture how much a moment mattered to the customer, so they can identify customer touchpoints by consequence rather than frequency. When stakeholders disagree and timelines are tight, that gap defaults to the loudest voice in the room.
This guide provides a decision-first, always-on prioritization framework: a repeatable scorecard grounded in traceable qualitative evidence gathered across the entire customer journey, rather than a one-time customer journey mapping workshop.
What are customer journey touchpoints?
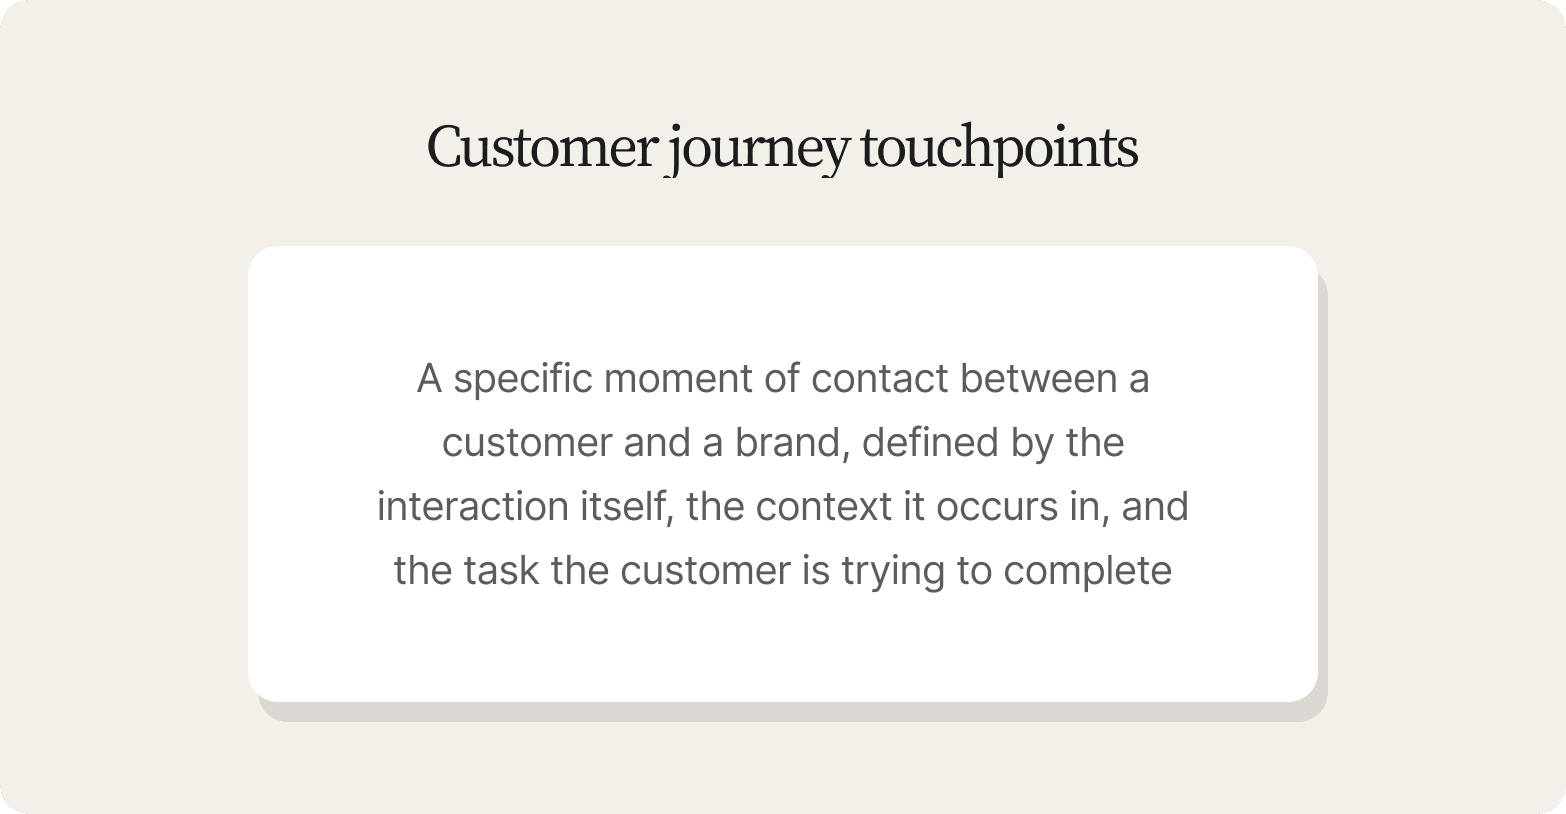
A customer journey touchpoint is a specific moment of contact between a customer and a brand, defined by three things: the interaction itself, the context it occurs in, and the task the customer is trying to complete, itself a proxy for customer needs regardless of the product or service involved.
The confusion between touchpoints and channels is widespread, and it is where a lot of customer journey analysis breaks down before it starts.
Channel: the medium through which customers interact with a brand, for example, email, a brick-and-mortar store, a call center, a mobile app, or social media.
Touchpoint: what happens inside that medium, for example, the abandoned cart email opened at midnight, the first call to support after a confusing bill, or the in-store moment a shopper cannot find a product they saw advertised online.
One channel carries dozens of touchpoints, each with its own emotional weight and power to shift how a customer feels about a brand. Treating the two as interchangeable produces journey maps, typically a visual representation of the path a customer takes, that look thorough but cannot tell you where customer experience actually breaks.
Teams that optimize at the channel level can miss that the specific touchpoint inside that channel, a late renewal reminder, is the one driving churn. Touchpoint-level understanding requires more than customer behavior data: knowing what a customer was thinking, expecting, and feeling at the moment of contact, the kind of evidence that only comes from real conversations.
Why most touchpoint inventories fail
Ranking by frequency instead of consequence
The standard touchpoint inventory has a structural flaw that no spreadsheet format fixes: it ranks by frequency. Traffic data, click volumes, and session counts, the customer data every analytics dashboard already has, are easy to pull, so they become the default sorting logic. The moments that appear most often rise to the top. The moments that actually decide the relationship get buried. The instinct is to pull more data rather than gather better evidence.
A checkout confirmation page might log thousands of visits weekly, while a first delivery or a complaint follow-up happens far less often. By volume, the confirmation page wins every prioritization meeting; by consequence, the delivery experience is where customer loyalty, and ultimately brand loyalty, is either formed or permanently damaged. Customer journey optimization built on frequency data optimizes for what is measurable, which rarely helps drive customer satisfaction.
No participant-level evidence
Teams know a touchpoint exists, and they can measure customer behavior at it, but rarely capture how much it mattered to the customer who experienced it. A one-point drop in a post-interaction customer satisfaction (CSAT) score looks like noise until someone explains that the interaction made them question whether to renew. Without that participant-level evidence, there is no defensible basis for ranking one touchpoint above another.
Most approaches miss a scorecard that ranks touchpoints across all three axes at once. Teams build prioritization matrices that look rigorous but rest on volume metrics and assumptions about what customers care about. The result is customer journey optimization work that covers only a fraction of the entire customer experience: operationally visible, strategically blind, and directed toward high-traffic moments while the rare, high-stakes customer interactions that decide customer retention go unexamined.
The prioritization scorecard
When every internal team argues their channel is the most important customer touchpoint to fix, the debate rarely settles anything. Marketing points to its marketing efforts and email open rates; retail points to old shelf placement research; product points to checkout conversion data. The argument runs on operational frequency and departmental ownership, rarely on what participants actually told you mattered to their decision.
A decision-first prioritization framework cuts through that by ranking touchpoints on three axes: business risk, customer impact, and evidence confidence, each scored 1 to 5 and treated as one of the key metrics stakeholders reference in a prioritization meeting. The combined score helps teams identify areas where evidence confidence is weakest, so effort goes there first.
Scoring rubric
| Score | Business risk | Customer impact | Evidence confidence |
|---|---|---|---|
| 1 | Negligible revenue or brand exposure | Rarely mentioned by participants | No recent qual data |
| 2 | Minor, recoverable | Mentioned but not decisive | Anecdotal or dated |
| 3 | Moderate, affects customer retention or trial | Cited as a factor in some decisions | Survey data, no verbatim |
| 4 | Significant, affects conversion or loyalty | Consistently cited as influential | Recent qual, limited depth |
| 5 | Critical, directly tied to purchase or churn | Named as a primary decision driver | Rich verbatim, video, traceable |
Worked example: Five touchpoints ranked
Consider a hypothetical CPG team running a new product launch that used this model to rank five customer journey touchpoints. Their initial instinct was to prioritize the onboarding email sequence, because it was the easiest to A/B test, though it rarely moves lifetime value the way an earlier moment in the buying process does. The scorecard told a different story.
| Touchpoint | Business risk | Customer impact | Evidence confidence | Total |
|---|---|---|---|---|
| In-store shelf placement | 5 | 5 | 2 | 12 |
| Checkout flow | 4 | 4 | 3 | 11 |
| Post-purchase follow-up | 3 | 3 | 4 | 10 |
| Support chat | 3 | 2 | 4 | 9 |
| Onboarding email | 2 | 2 | 5 | 9 |
In-store shelf placement, the quintessential brick-and-mortar touchpoint, ranked first because participants repeatedly named the shelf moment as the point where they made or abandoned their decision, even though the team hadn't originally prioritized it. Evidence confidence was low because the team hadn't studied that touchpoint in two years. The scorecard made that gap visible and defensible to every stakeholder in the room.
A touchpoint with high business risk and high customer impact but low evidence confidence is an active liability. Conveo is built to close exactly that gap: it captures participant language at the moment of decision so evidence confidence scores can move from 2 to 4 within a single study cycle, and stay there as each new research wave updates the scorecard.
How to uncover why customer journey touchpoints fail
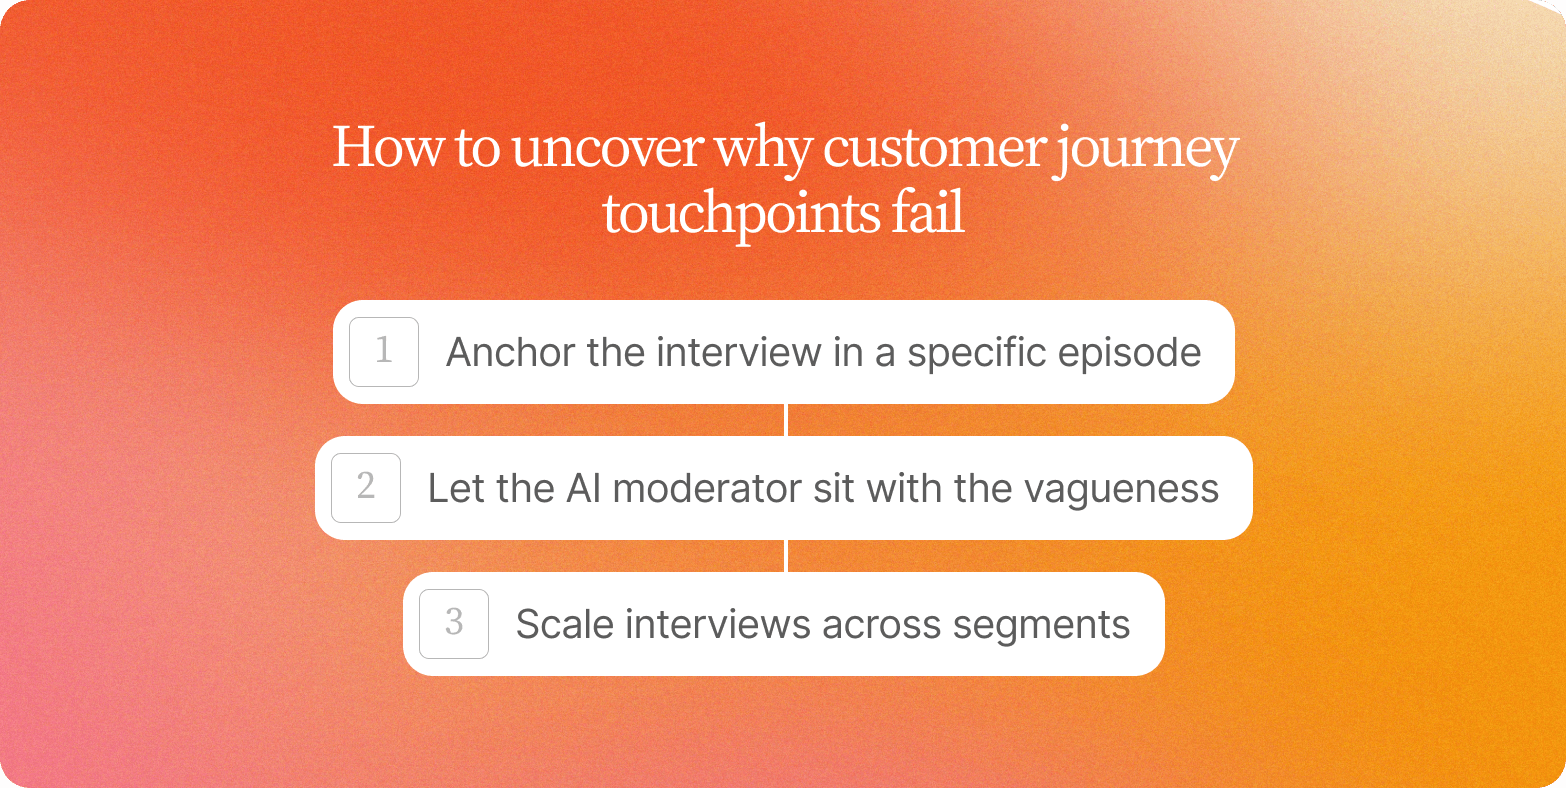
Anchor the interview in a specific episode
Most teams collect feedback through survey-based customer feedback loops, support tickets, and online reviews, which tell you a touchpoint scored poorly but rarely which specific moment caused a customer to pause, look elsewhere, or quietly disengage. The fix is a depth interview anchored to a real, recent episode: "walk me through the last time you tried to complete a purchase," rather than a general question like "how do you generally feel about our checkout process."
That reconstruction discipline matters because customers rationalize decisions after the fact. When an interview opens with a specific episode, participants narrate what actually happened: what they clicked, read, hesitated over, and did next. The pain points surface in that sequence, the kind of detail a single rating score would flatten.
Let the AI research assistant sit with the vagueness
Where this approach gets genuinely diagnostic is in the follow-up. Participants often give vague reactions at first, "it felt a bit confusing" or "I wasn't sure I trusted it." A scripted discussion guide moves on. Conveo's AI research assistant stays with the vagueness until the specific customer concerns are named: which word felt confusing, or what would have built trust at that moment. That is where switching criteria live, and they rarely appear in a first response.
The practical objection teams raise is whether AI moderation can follow that thread the way a skilled human moderator would. In practice, Conveo's AI research assistant probes based on what participants actually say instead of a fixed script, so a vague reaction triggers a follow-up rather than a transition. The blocker gets stated and captured in timestamped video with verbatim quotes. Stakeholders and business leaders reviewing the findings can locate the exact second a participant's tone shifted or a misconception surfaced. That traceability is what moves a finding from "the team believes" to "here is the evidence."
"You see them physically doing it. Testing the product for the first time, being probed right there. That unfiltered, in-the-moment reaction is possibly the most powerful thing you can see as a researcher."
Dafydd Jones, Associate Director, Ninth Seat
Scale interviews across segments
Because sessions run asynchronously, teams can run touchpoint interviews across multiple segments of the target audience in parallel, so findings arrive while the prioritization decision is still open.
Omnichannel customer journey research in practice
When channel signals conflict
When the omnichannel customer journey produces conflicting signals, the problem is almost never the data. Analytics can track customer interactions across channels and show you that customers who browse on mobile and convert in-store have a lower repeat rate than those who stay digital, or that social media monitoring shows a spike in complaints. What analytics cannot show you is why the handoff feels wrong. That gap is where assumptions harden into bad decisions.
Segment before you recruit
The practical approach starts before the interview guide:
Define two to four behavioral segments, closer to buyer personas than broad demographic buckets, using signals you already have: channel sequence, drop-off point, purchase frequency, or return rate.
Turn each segment into a recruitment criterion.
Recruit five to fifteen participants per segment, enough variation to identify a pattern without the sample size ballooning the timeline.
That segmentation step is what makes qualitative depth achievable at this scale.
Validate the assumption inside the session
The session validates or revises the assumption embedded in your analytics. If your data suggests that customers who visit a brick-and-mortar store after browsing online convert at a lower rate, ask participants in that segment what they were looking for that the website didn't give them, and what happened when they arrived. Timestamped video recordings let you revisit the exact moment a participant's tone shifts or their explanation becomes hesitant, a non-verbal signal about whether the friction was informational, logistical, or experiential.
Turn interviews into testable assumptions
The output is a set of revised assumptions your analytics team can test at scale, closing the gap between what your channel data shows and what customers moving across multiple platforms actually experience in the omnichannel customer journey.
From one-time mapping to always-on understanding
Journey maps go stale. Most teams know this. A workshop runs, teams map the customer journey once, a deck gets filed, and six months later the drivers behind a support spike or a checkout-abandonment jump have shifted in ways the research never anticipated. The map is still on the wall. The understanding is already out of date. That's the customer journey mapping process failing in real time.
Conveo StoryLines is Conveo's continuous, wave-based AI-moderated research program: rather than a one-time mapping exercise, it runs touchpoint research in structured waves over time, so teams can see where participant behavior at a touchpoint shifted between waves. The full history behind those waves lives in a searchable insight library that gives teams a unified view of findings across projects, surfacing valuable insights so nothing gets researched twice. A researcher asking why support contacts are rising in Q3 can pull consumer insights from the Q1 and Q2 findings alongside the current wave and see exactly where the story changed.
Teams stop re-running the same foundational discovery every time a stakeholder asks a familiar question. Touchpoint drivers like "reasons for support contact" or "barriers at checkout" stay current and searchable. Understanding compounds across quarters and markets, spanning the entire customer lifecycle from initial awareness through renewal, rather than starting from zero with each study. For a small research team serving an enterprise stakeholder base, that compounding effect becomes a competitive advantage: the difference between keeping up with demand and perpetually falling behind it. That's what customer journey management looks like as an ongoing discipline.
Touchpoint research workflow
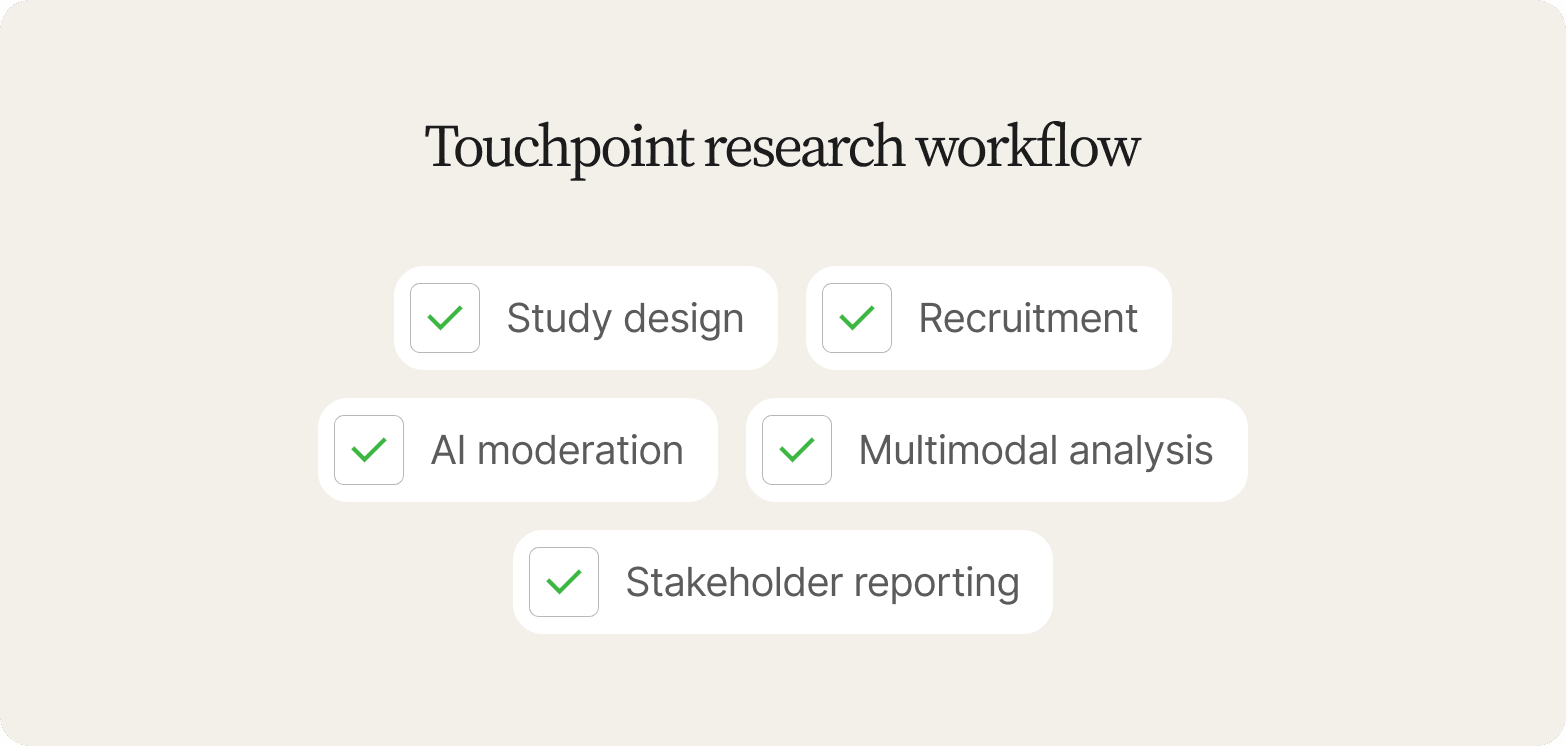
Touchpoint research that actually informs decisions runs through five connected steps. Each is a place where traceability gets built in, or left out.
Study design. Before a single participant joins, the research question gets scoped around the journey stages that matter: initial awareness, brand consideration, first use, repurchase. The discussion guide is structured per touchpoint, so moderation follows the customer's arc rather than jumping between themes.
Recruitment. Participants are sourced through Conveo's network of 8 integrated panel providers plus your own customer lists, with screeners tuned to the target market and journey stage. Teams can also recruit from their own customer relationship management (CRM) systems via CSV upload, for studies needing existing customers with documented purchase history rather than a general panel.
AI moderation. Each participant works through the journey arc on their own schedule with Conveo's AI research assistant, which adapts its probing based on what participants actually say, staying close to the customer's perspective at each touchpoint, rather than running a fixed script. Conveo can field 100 interviews in 3 days, which means a full journey study across multiple segments moves at that pace too.
Multimodal analysis. As sessions close, Conveo analyzes speech, tone, and facial cues per touchpoint. Themes surface at the stage level, helping teams identify patterns that a study-wide summary would flatten, so checkout friction looks different from onboarding friction in the same report.
Stakeholder reporting. This is where traceability separates credible customer journey analysis from assumption-dressed-as-data. Conveo attaches verbatim quotes and timestamped video clips directly to each finding, so a touchpoint-level report is traceable to the second and can provide valuable insights stakeholders act on immediately. A stakeholder reviewing the report can click through to the exact moment a participant described the friction, flag it for follow-up, and verify the finding themselves. That auditability is what makes the report defensible in a product review or a budget conversation with business leaders.
See it in action in Reading a Conveo Report:
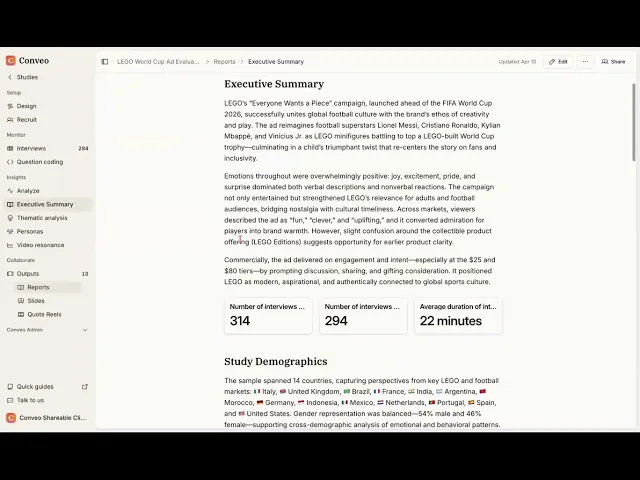
3 common touchpoint failure modes
Three failure modes show up repeatedly when teams audit their customer journey touchpoints, and each one helps identify areas for improvement before a single interview is run.
1. The silo problem
Touchpoint ownership is divided across marketing, product, CX, customer success, and sales, with each function mapping only the interactions it controls. The result is a patchwork inventory that mirrors internal processes rather than the path a customer actually travels, and handoff moments, which service blueprints are meant to map, go unexamined. Those handoffs are where customers disengage rather than where customers engage, and no single team knows why. Workflow automation can route those support tickets efficiently while leaving the reason for the volume spike undiscovered.
2. Inconsistent messaging across the same touchpoint
Teams frequently assume that brand messaging is consistent because it was approved centrally. In review, participants describe meaningfully different experiences at the same touchpoint depending on the communication channels involved or the customer's geography. That assumption is what stops teams from testing it.
3. Assumed understanding, unverified
The most common failure is treating internal stakeholder alignment as a proxy for customer understanding. A team agrees on which touchpoints matter, assigns priority scores, and moves to optimize customer touchpoints without ever asking customers what they actually experienced at each stage. When findings arrive later, often through a complaint spike, the gap between assumed and actual customer experience is already wide.
All three patterns share a root cause: the inventory was built from the inside out, using internal data and team consensus rather than the direct customer input needed to identify areas where real risk actually lives.
Why this needs to run continuously, not once
A touchpoint scorecard built once decays the moment the journey changes underneath it. The evidence-confidence axis in this framework is only as good as the last wave of research behind it, which is why the strongest version of this approach treats touchpoint research as always-on infrastructure, the same logic behind Consumer Understanding Infrastructure, built to anticipate customer shifts. That's the foundation for data-driven decisions.
Conveo's AI-moderated interviews give you the participant-level evidence the scorecard's customer-impact and evidence-confidence axes depend on. Conveo StoryLines keeps that evidence current wave over wave, and its searchable insight library keeps every past wave accessible, so a new stakeholder question doesn't require starting the research from zero. Together, that's what turns a one-time prioritization exercise into a scorecard that stays accurate as the customer journey shifts.
Frequently Asked Questions
What is customer journey analysis?
Customer journey analysis is the practice of examining every one of the interactions customers have with a brand, across channels and stages, to understand what's working, where friction builds, and why. It goes beyond customer behavior data: clicks and drop-off rates tell you where customers leave. The "why" requires direct conversation.
What is an omnichannel customer journey?
An omnichannel customer journey is the full sequence of interactions a customer has with a brand across multiple channels, where channels connect rather than operate in isolation. Customers, whether new customers or long-time accounts, move between websites, apps, physical locations, and support channels. Friction most often appears at the handoff points between channels, which is exactly where cross-channel qualitative research matters most.
How do you prioritize which touchpoints to optimize first?
Start with the touchpoints where customers switch channels unexpectedly or abandon the journey entirely. Behavioral data can identify where drop-off happens; qualitative research reveals what drove the decision, and teams that combine both get to root cause faster. Prioritize by customer-reported consequence, then by where evidence confidence is weakest, the moments where touchpoints most engage customers, such as a potential customer's first purchase or an existing customer's renewal decision.
How often should customer journey analysis be updated?
Customer journeys shift with product changes, market conditions, and evolving customer expectations across the customer lifecycle, so periodic analysis produces findings that are already dated by the time they inform a decision. Teams running continuous research programs catch journey shifts in near-real time, rather than discovering them months later in a quarterly report. The goal is an ongoing read instead of an annual or biannual audit.
What counts as "evidence confidence" in the scorecard?
Evidence confidence measures how current and traceable your understanding of a touchpoint actually is, beyond simply whether data exists. A touchpoint with recent verbatim, video-backed research scores a 5; one with only dated or anecdotal input scores a 1 or 2. It's the axis that most often exposes a gap between how confident a team feels about a touchpoint and how much real evidence backs that confidence, one of the key metrics executive stakeholders ask about first.

About the author
Meg Gerli
Research Impact Lead
Meg is a Research Impact Lead at Conveo, working with insights and research teams on the studies they run with Conveo.
Meet Meg on film →Qualitative insights at the speed of your business.
Conveo runs AI-moderated video interviews and structures everything they say.