


TL;DR
Many research teams use multiple tools to analyze survey data and share findings. This creates compliance risks and makes it harder to understand the context behind your survey response data.
Every analysis method has limits. When survey data shows a pattern but not the reason behind it, qualitative research gives you the missing context.
When survey results raise a question the numbers can't answer, Conveo turns those signals into follow-up interviews on the same platform, taking you from pattern to stakeholder-ready qualitative insight in days, not weeks.
Research teams can send out a survey and collect hundreds of responses in days. The challenge is knowing the best way to analyze the data and turn it into something usable.
This guide walks through the core statistical analysis methods for survey data, how to analyze open-ended responses at scale, and how to know when survey data analysis has taken you as far as it can.
By the end, you'll have a clear framework for choosing the right approach and turning survey results into data-driven decisions your stakeholders can act on.
What Is Survey Data Analysis?
Survey analysis used to mean counting responses in a spreadsheet. Now teams run statistical tests, review open-ended answers, identify themes, and produce reports, often using several different tools.
The methods look different, but the end goal hasn’t changed: turning raw survey data into findings you can act on. There are two main approaches to survey data analysis:
Descriptive statistics summarize the numerical data you collected, for example, the average satisfaction score or how many people chose each option in a question.
Inferential statistics go further by testing hypotheses and drawing conclusions about an entire population, for example, estimating overall customer satisfaction based on a sample of responses.
Quantitative survey data tells you what customers think or do, but it can't tell you why. When the results raise a question you can't answer with more analysis, qualitative research methods like interviews give you the depth you need. Building them into your research workflow from the start saves time later.
"It picks up on the nuances a survey never could."
- CMI Lead, Edgard & Cooper
How To Check Your Data Quality Before Analysis
If your raw data isn’t up to scratch, you’ll get unreliable research findings no matter which analysis method you choose. Run these checks before you begin.
Check Your Response Rate and Who Didn't Reply
Studies show that the median survey response rate is 29%, though this varies depending on what industry you’re in. If your response rates are much lower than your industry norm, it limits how confidently you can generalize the findings. Consider sending a follow-up reminder and extending the survey period before you analyze the data.
If you know basic details about everyone you invited to the survey, you should also compare them to the people who responded. Check whether certain age groups, job roles, or regions show up more or less often in the responses than they do in the full audience. If some groups are missing or overrepresented, your results may be biased, and you should treat them with caution when reporting findings.
Clean and Validate Your Responses
Even a few low-quality responses can skew your findings. Check for these common issues:
Duplicates: Look for identical responses or multiple submissions from the same device.
Missing answers: Decide whether to remove incomplete responses or work with what you have.
Outliers and unusual patterns: Data points like responses completed in under a minute or every question answered the same way.
These checks prevent errors from shaping your results. If you see these patterns frequently, they can signal a problem with the survey itself. It may be worth revisiting the survey design or following up with interviews to get more considered responses.
Check Whether Your Sample Reflects Your Population
Sometimes your participants don't match the group you care about. For example, if women make up 60% of your target audience but only 40% of participants, your results will over-represent men.
Weighting corrects for this by giving underrepresented responses more weight in the final count. In the example above, each woman's response would be counted as 1.5 rather than 1, so the results reflect the right balance.
If you apply weighting, document what you changed and why, so others can follow your logic later.
4 Common Methods for Survey Data Analysis

Once your data is clean and representative, you can start analyzing it. Below are the core statistical methods of analysis for survey data, used in survey research, and when to use them.
1. Cross-Tabulation (Crosstabs)
Crosstabs show how two groups relate to each other.
For example, you might compare whether brand awareness differs across age groups. The output is a simple table that breaks responses across both groups, so you can quickly see patterns.
Use crosstabs when you want to compare categories like demographics, yes/no answers, or multiple-choice responses. They're one of the most common survey data analysis methods for nominal data, where responses fall into distinct groups with no natural order.
To test whether a pattern is likely real rather than random, you can run a chi-square test. This tells you whether the difference between groups is statistically significant. But significance alone can mislead you. With large samples, even small differences can look important, so you should also check how big the difference actually is, not just whether it exists.
2. T-Tests and ANOVA
T-tests compare the average result between two groups. For example, you might compare satisfaction scores between users on two pricing plans.
ANOVA does the same thing when you have three or more groups, such as comparing satisfaction across multiple customer segments.
These methods assume your data is roughly normally distributed and that variance stays similar across groups. When those assumptions don’t hold, results can mislead you, so you may need alternative tests.
3. Regression Analysis
Regression helps you understand which factors are most strongly related to an outcome.
Use linear regression when your outcome is a score, such as Net Promoter Score (NPS), and you want to see which customer experience factors are most closely related to it.
Use logistic regression when the outcome has two possible states, such as whether a customer churned or not.
The output shows how each factor relates to the outcome while accounting for the influence of the other factors in the model. For example, it can show whether onboarding satisfaction is still strongly related to NPS even when you include other parts of the customer experience. Watch for correlated variables among your predictors: when independent variables are strongly related to each other, it becomes harder to identify relationships and coefficient estimates become unreliable.
4. Cluster Analysis and Segmentation
Cluster analysis finds natural groupings in survey data when you don’t already have segments.
Methods like k-means assign each response to a group based on similarity.
Hierarchical clustering builds layers of groups, which helps when you don’t know how many segments you need.
You need to validate each segment. A useful segment should differ in meaningful ways, not just in the data used to create it, but also in real behavior or attitudes. Once you create segments, name them in plain language based on what they represent.
Statistical methods tell you what happened and how groups differ. They don’t tell you why a segment behaves the way it does or what drives the pattern. When cluster analysis shows a segment but you can’t explain its motivation, don’t add more variables. Talk to people instead.
Conveo helps teams move from statistical segments to qualitative understanding by using survey responses to screen participants for follow-up AI-moderated interviews.
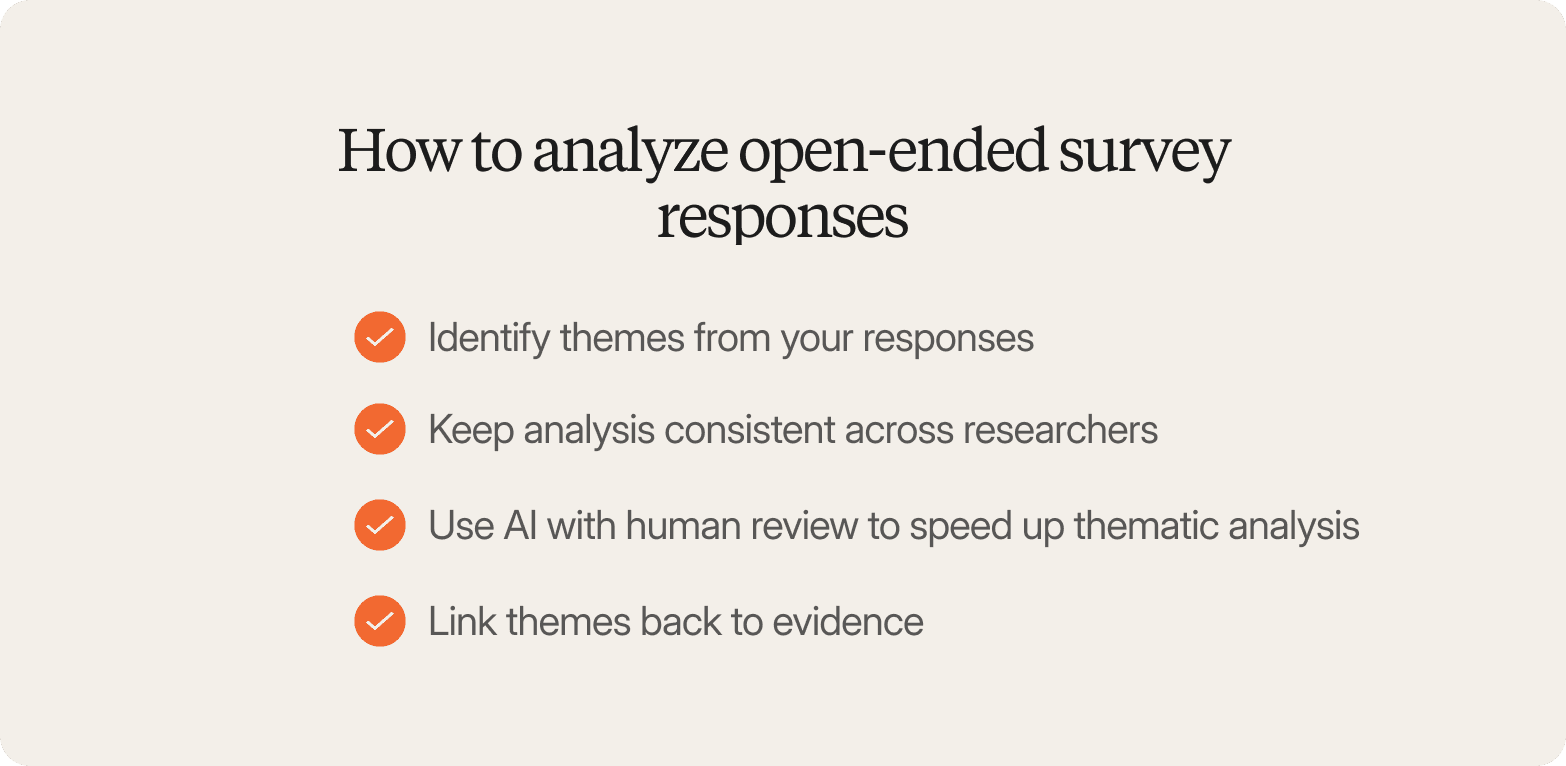
How to Analyze Open-Ended Survey Responses
Open-ended questions produce rich qualitative data that closed-ended scales can't capture, but they’re harder to analyze because responses vary widely and don’t fit into predefined categories.
Here are some guidelines for analyzing short answer questions and open-ended responses, including the checks that make your findings trustworthy and scalable.
Identify Themes From Your Responses
Categorizing responses into different themes makes them easier to quantify. The process works like this:
Start by reading a sample of responses to understand the range of answers. Around 50 to 100 is usually enough to begin.
From there, group similar ideas together. Give each group a clear label and define what it includes. This becomes your codebook.
Use the codebook to tag a subset of responses, then refine it as you go. Some codes will overlap or turn out too vague, and you’ll need to adjust them.
Once the structure feels stable, apply it to the full dataset. Then group related codes into broader themes and pull out direct quotes that support each one.
Don’t rush into tagging everything too early. If you start assigning labels before you understand the full spread of responses, you’ll miss important patterns and end up reworking your structure.
Keep Analysis Consistent Across Researchers
If more than one person is tagging responses, they should each work through the same sample independently first.
This checks whether they’re applying the same labels to the same ideas. This is called inter-coder reliability (ICR).
A common way to measure this is Cohen’s kappa. A score above 0.70 is usually acceptable, and above 0.80 is strong. If agreement is low, the team should review differences and tighten definitions before continuing.
This matters because tagging responses involves judgment. Two people can interpret the same answer differently if the categories aren’t clear. Without this check, results can vary depending on who did the analysis.
Documenting agreement also makes the analysis easier to defend later, since others can see how consistent the process was.
Use AI With Human Review to Speed Up Thematic Analysis
AI can speed up the first pass of coding by grouping similar responses and suggesting themes. Some survey analysis tools also generate word clouds and run sentiment analysis to give a quick read on tone across responses. This helps when you have large volumes of open text that would take days to process manually.
But AI still misses nuance. It can misread context or unusual phrasing, and it tends to force responses into neat categories even when they don’t fit.
A better approach is to let AI build an initial structure, then have a researcher review and validate it before finalizing anything.
See it in action: How to Build and Launch a Study from Scratch in Conveo →
Link Themes Back to Evidence
Every theme should connect back to real responses. This lets others see exactly where your conclusions come from.
For each theme, include a few direct quotes and note how many people expressed a similar idea. This makes your findings easier to trust and easier to challenge.
When someone questions a result, you should be able to point straight back to the underlying responses.
When Survey Data Isn’t Enough
The methods for how to analyze data from a survey above help you turn survey responses into reliable patterns you can compare and report, but survey data has limits.
Surveys can highlight differences between groups and changes in key metrics, but it can’t draw meaningful conclusions about the motivations or context behind those patterns.
When you need that level of understanding, the next step is to move beyond surveys. One practical approach is to use survey answers to identify and recruit participants for follow-up interviews. With AI moderation, you can run these interviews quickly and get data from participants as they respond, often within a few days, so you can explore the reasoning behind the patterns you saw in the data.
This approach keeps the workflow connected. You start with survey signals, then move directly into conversations that explain them in more depth, without having to rebuild your research process or create extra manual work.
How to Choose the Right Survey Analysis Method
Now that you’ve seen the main ways to analyze survey data, the next step is choosing the right approach for your study. The method you choose depends on your research objective. Find yours below.
If You Want to Understand How Your Audience Responded Overall
There are two approaches depending on the type of question you asked:
For multiple choice or categorical questions (like which product tier customers are on or which region they're from), use crosstabs. These show how responses are spread across each option and whether certain groups answered differently.
For rating scales or numeric questions (like satisfaction scores or NPS), use averages. These show where responses tend to cluster and how spread out they are.
If You Want to Compare Results Across Different Groups
Use this when you want to know whether differences between groups in your data are meaningful or just down to chance.
If you're comparing two groups (like new vs. returning customers), use a t-test. This tells you whether the difference in their average scores is statistically significant.
If you're comparing three or more groups (like satisfaction scores across regions or customer segments), use ANOVA. This tests whether at least one group differs meaningfully from the others.
If You Want to Know What's Influencing an Outcome
Use this when you want to go beyond describing what happened and understand what's driving it.
If the outcome is a number (like an NPS score or revenue), use linear regression. For example, you could use it to find which parts of the onboarding experience are most strongly linked to higher satisfaction.
If the outcome is yes or no (like whether a customer churned), use logistic regression. For example, you could use it to identify which survey responses are most associated with customers leaving.
If You Want to Find Segments That Weren't Defined in Advance
Use cluster analysis when you want to let the data reveal its own groupings rather than imposing categories you've already decided on. For example, you might use it to identify distinct behavior-based customer segments that didn't show up in your original audience breakdown.
The output is a set of groups whose members answered in similar ways. You then name and interpret each group based on what they have in common.
If You Want to Know Why Something Is Happening
Survey data can't answer this directly. It can show you patterns and differences, but it can't explain the context behind them. If your research objective is to understand why customers behave a certain way, you need qualitative research where participants can explain their reasoning in their own words.
When to Get Statistical Help
Some survey analysis goes beyond standard methods and needs specialist input. This usually applies in a few situations:
When you need to adjust for who responded vs who didn’t. For example, if certain regions or customer types are overrepresented in your responses, you may need weighting to make the results reflect your full audience.
When you’re testing many variables at once. For example, looking at how onboarding, pricing, support, and product usage together influence churn or NPS.
When standard assumptions don’t hold. For example, when data is heavily skewed or common tests like t-tests or regression don’t produce reliable results.
When results need to meet formal requirements. For example, in regulated reporting or audits where methods must be clearly documented and defensible.
In these cases, bringing in a statistician or research methodologist early helps prevent errors that are difficult to correct later and ensures the analysis can stand up to scrutiny.
How to Ensure Your Survey Analysis is Trustworthy
In most research settings, you need to show how you reached your findings for them to be usable. Well-documented analysis produces survey insights that stakeholders can interrogate and trust, which is what turns important data into valuable insights that actually influence decisions.
Document Your Analysis As You Go
Proper documentation means that you can walk stakeholders through a paper trail and audit the data analysis, survey methods, and techniques you used. It also creates a roadmap for future studies. Document:
Document the analysis plan before you start analysis, including what you intend to test and how you will approach the data.
Record all data cleaning steps, including what you removed and why.
Document any weighting applied, including how you adjusted the data and what the final sample looks like after weighting.
List the statistical tests you ran, along with the survey analysis software and version you used.
Keep this documentation in a shared location with version control.
Confirm Data Handling and Compliance Requirements
Survey data containing personal identifiers falls under GDPR in the EU and under various state-level laws in the US. This is an important part of how you approach customer research responsibly. Before you collect data, confirm:
Where participant data will be stored and for how long.
Who has access to raw responses.
How deletion requests will be handled.
Whether your vendor is SOC 2 certified and GDPR-compliant.
Enterprise procurement teams will ask for all of this. Tools that can't answer these questions in documentation won't pass IT or legal review, regardless of how strong their features are.
Link Your Findings Back to Their Source
Structure your outputs so that every claim links to a statistic and every qualitative theme links to a direct quote. This makes findings defensible when challenged.
For quantitative data, present data visually where possible: line charts work well for tracking scores over time, while pie charts show distributions across categories. Include confidence intervals alongside point estimates.
For qualitative data, include the quotes and clips that support each theme. Stakeholders who can inspect the evidence are more likely to act on the findings.
Research Ops teams trust Conveo's SOC 2 certification, GDPR compliance, and regional data hosting to pass procurement reviews without manual workarounds. SSO support and role-based access controls are included as standard.
"Conveo's video-first approach is a real differentiating methodological advantage. The ability to distill insights from reactions and not just hear answers adds context you simply can't get from transcript-only tools, or any other tool in the market for that matter."
- Senior Marketing Research & Insights Manager, Google
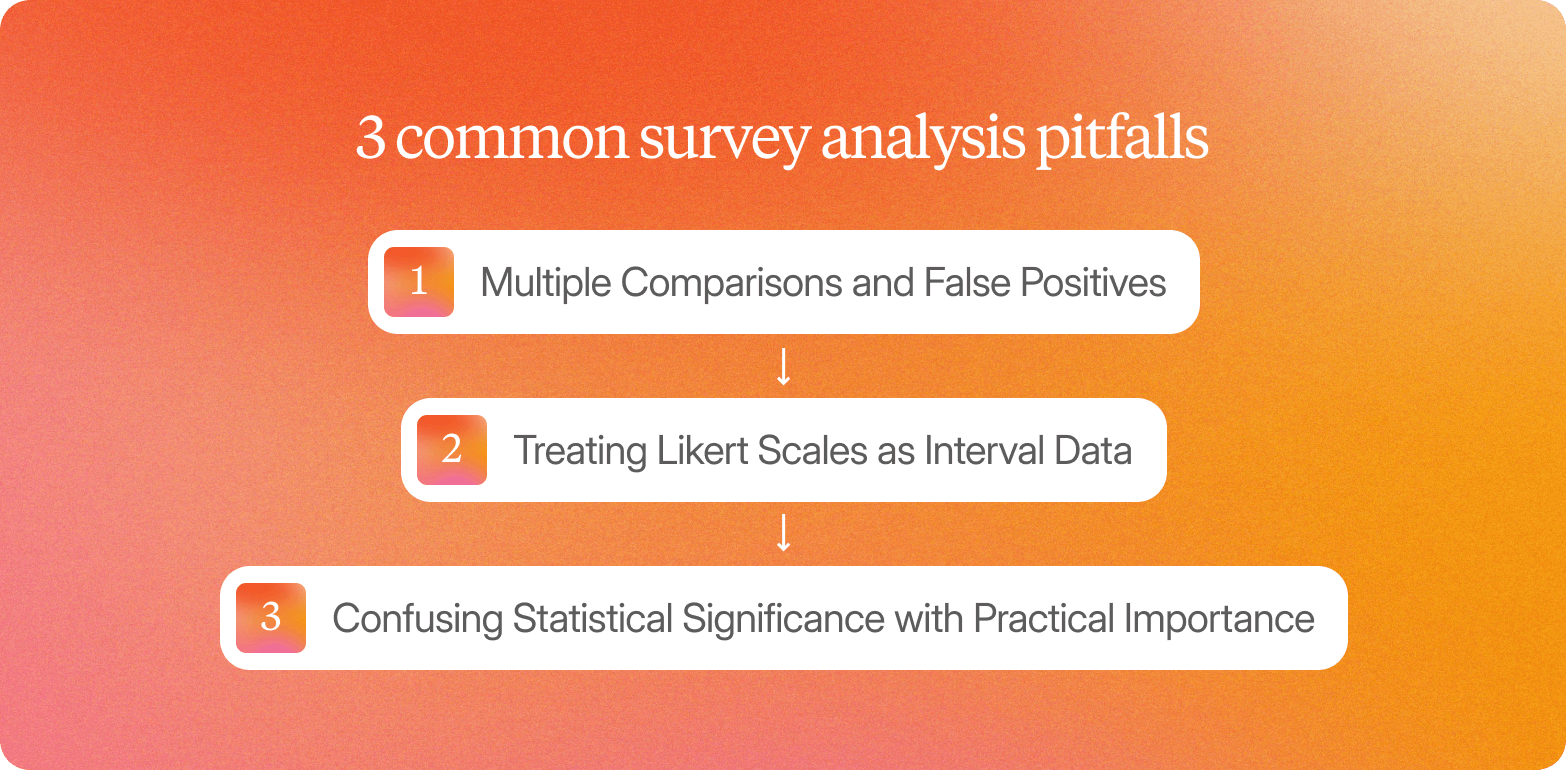
3 Common Survey Analysis Pitfalls and How to Avoid Them
Even when your statistical analysis methods to analyze survey data is well documented, it can still go wrong in subtle ways. These are three common issues to watch for when analyzing survey data.
1. Multiple Comparisons and False Positives
When you run many statistical tests, you increase the chance of finding a result that looks meaningful but is actually due to chance. For example, testing lots of different survey questions across groups will almost always produce at least one “significant” result, even if nothing real is happening.
To reduce this risk, you can adjust your significance threshold when running multiple tests. One common approach is the Bonferroni correction, which makes the threshold more strict as the number of tests increases.
Make sure you document how many tests you ran and whether you adjusted for this, so others can understand how reliable the results are.
2. Treating Likert Scales as Interval Data
Likert scales (for example, 1 = strongly disagree to 5 = strongly agree) rank responses, but the distance between points is not guaranteed to be equal.
Some teams treat them as numeric data and calculate averages, especially when there are enough response options and a large sample size. Others treat them as ordinal data and use medians instead.
Both approaches can be acceptable, but you need to be clear about which one you chose and why.
3. Confusing Statistical Significance with Practical Importance
A statistically significant result (usually p < 0.05) only means the result is unlikely to be due to chance. It does not tell you whether the difference is large enough to matter.
With large datasets, even very small differences can appear statistically significant. That does not automatically mean they are meaningful for business decisions.
Always interpret results in context and consider whether the size of the difference is practically important, not just whether it passes a significance threshold.
From Survey Signals to Qualitative Depth with Conveo
Thematic and statistical methods for survey data analysis tell you what is happening in your data and how groups differ. When they can't explain why, Conveo picks up.
Analyze open-ended responses without manual coding. Conveo transcribes voice and video responses and extracts themes automatically, with every finding linked back to the original clip. Teams don't need separate transcription tools or coding software, and findings from different surveys build on each other over time.
Replace your research tool stack with one platform. Research Ops teams run the full workflow in one place: recruiting, interviews, analysis, and reporting. No stitching together separate vendors or exporting between tools.
Pass procurement reviews without extra legwork. Conveo is SOC 2 certified and GDPR-compliant, with EU data hosting, SSO, and role-based access controls included as standard.
Move from survey data to qualitative findings in days. Use survey responses to identify which participants to interview next. Conveo runs those interviews automatically, in participants' own time, and delivers themes linked to video evidence your stakeholders can watch.
Frequently Asked Questions
What are the main survey data analysis methods in research?
How do you analyze open-ended survey responses at scale?
What is the difference between descriptive and inferential survey analysis?
When should you move from survey analysis to qualitative research?
What statistical methods are best for analyzing survey data?
How do you ensure survey analysis is auditable and reproducible?


