In this article
TL;DR
The gap: Stated willingness to pay overstates real purchase behavior. Teams know it, so they apply an inherited rule-of-thumb discount before presenting findings, an adjustment that is often larger than the effect being measured and rarely appears in the write-up.
The fix: Measuring willingness to pay in a way that captures the conditions a participant attaches to a price, alongside the number itself, so the adjustment becomes visible instead of instinctive.
The outcome: Business decisions on price and portfolio grounded in what consumers meant when they named a figure, with no quiet correction applied by whoever ran the study.
Where Conveo fits: Conveo's AI research assistant surfaces the reasoning behind a stated price in the same session in which it's captured, so the context and the number come from the same person.
Pricing decisions close before the real number is understood
A pricing decision doesn't wait for the correction. A team collects data on customers' willingness to pay, applies a discount because everyone knows the stated figure runs high, and locks a launch price, all before anyone has diagnosed what the discount should be for this category, this concept, this price point.
The figure itself is usually defensible. The reasoning behind it never gets captured, so the adjustment applied to it is a guess dressed up as a convention. Market research that captures the conditions attached to a price, as well as the figure, turns that guess into something a pricing strategy can rest on.
What is willingness to pay?
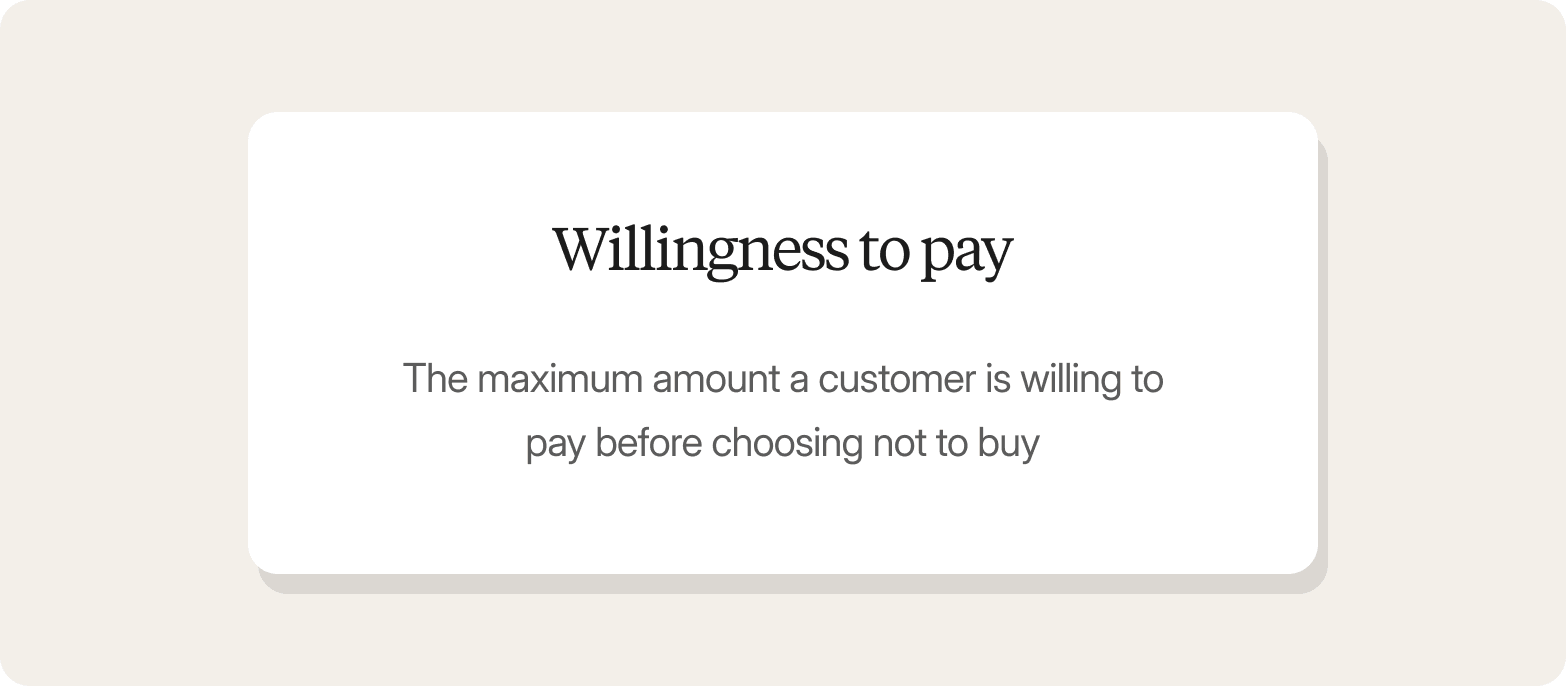
Willingness to pay is the maximum amount a customer is willing to pay before choosing not to buy. It is a ceiling: the point at which the value a specific customer perceives no longer justifies the cost.
Researchers work with two versions of that ceiling.
| Concept | What it measures | Where it matters |
|---|---|---|
| Individual WTP | What one customer will tolerate. A customer's willingness to pay moves substantially with context. | Launch pricing, price corridors |
| Marginal willingness to pay (MWTP) | How that ceiling shifts with one change: an added feature, a different pack size, a new market. | Optimal pricing and price-pack architecture |
WTP varies depending on numerous factors: the customer segments you sample, the purchase occasion, and the alternatives available alongside the product. Different customers anchor to different reference points, which is why consumer willingness to pay is best expressed as a range across a population. WTP research maps that range precisely enough to determine a launch price from evidence, and cost-plus assumptions rarely reflect what your target customers value.
Why stated WTP overstates real behavior
When participants name a figure in market research surveys, they routinely land above what they would pay at the shelf. Stated figures drift high for numerous factors: agreeing a price is fair is easier than declining it, no budget is actually spent in the moment, and nobody has to give anything up to say yes.
The gap is consistent enough that teams apply a correction almost by reflex, often inherited from a previous agency. Left uncorrected, those figures overstate real market demand and inflate the average WTP a team carries into a launch meeting.
Standard price tests don't explain the gap. Van Westendorp shows where the acceptable range sits, and Gabor-Granger shows where volume falls off, but neither tells you what a participant was imagining: the retailer, the occasion, the competing product on the shelf, or the condition they silently attached to the price before agreeing it was fair. Both record the figure without the reasoning, which leaves the exact willingness to pay of any one buyer unobservable from survey data alone.
How to choose a method for measuring WTP
Measuring WTP well starts with treating method choice as a structured evaluation process. Three questions decide it: what decision are you making, how much risk can you absorb if the number is wrong, and how fast do you need an answer?
| Research goal | Method | What you get | Where it stops |
|---|---|---|---|
| Determine a price corridor for a new product | Van Westendorp PSM | An acceptable range of price levels plus an optimal price point, extendable with Newton-Miller-Smith purchase intent ratings | Teams read that point as an optimal pricing recommendation. It marks the point of balanced resistance, and maximum revenue usually sits elsewhere. A price low enough to attract customers can undercut quality perception and damage customer satisfaction |
| Find the revenue-maximizing price point | Gabor-Granger pricing method | A demand curve and a revenue curve, useful for promotional floors that attract new customers or pressure-testing an increase | Hypothetical bias. Participants answering market research surveys are not reaching for their wallet, so read the output as a guardrail on market demand |
| Price product features and pack architecture across customer segments and different demographics | Conjoint analysis | Part-worth utilities across several configurations, letting you calculate willingness to pay at the margin for a specific customer | Relative outputs only. It ranks which features win the consumer trade-off decisions without explaining the job a buyer hires the feature to do |
| Understand why a price feels wrong to potential customers | AI-moderated qualitative interviews | The conditions attached to a stated figure, every claim traceable to video | Smaller samples, so it sizes nothing on its own |
The three quantitative methods run the same evaluation process from different angles. Van Westendorp and the Gabor-Granger pricing method both assess price acceptance; conjoint pricing presents product features to a buyer and forces consumer trade-off decisions. None of them explains its own number, and different customers hesitate for very different reasons. Estimating WTP is only half the task, which is why, for most enterprise teams, the practical answer is a combination: one quantitative method to size the range and one qualitative layer to explain it. There are multiple ways to calculate WTP, and none of them is self-sufficient.
One floor-level warning applies across all three. The too-cheap threshold deserves as much attention as the ceiling: pricing low to attract customers wins volume and can cost trust, and a product that reads as suspiciously cheap tends to convert badly and damage customer satisfaction later.
How to get the why behind WTP
When a participant says "I'm not sure I'd pay that much," a static survey records the hesitation and moves on. What it cannot do is follow up: What price feels right? What would make the higher price worth it? Which alternative would you switch to instead?
Adaptive probing fills that gap. Using Conveo's AI research assistant, researchers follow what participants actually say and adapt their questioning in the moment. When hesitation surfaces at a specific price point, the AI research assistant probes the underlying value perception: the comparison being made, the reference price, and what would need to change for the number to feel fair.
That turns a vague objection into an actionable threshold, and it surfaces the common factors that move a buyer from a lower willingness to pay to a higher WTP: a missing value signal, an unfamiliar comparison set, a switching cost nobody had priced in.
Admitting price sensitivity or anchoring to a competitor feels awkward in front of a person, so reference prices and switching triggers surface more candidly in an AI-moderated session. That is where the reasoning behind a customer's WTP comes into play.
Multimodal analysis adds what transcripts cannot: a pause before answering, a shift in tone at the price reveal, and a visible reaction on screen. Knowing the break point is useful. Knowing what caused it is what grounds a pricing strategy.
"Conveo has definitely changed what we can pitch to clients, because it allows us to bridge the gaps between quantitative and qualitative methodologies and tell a more complete end-to-end story. It lets us close the loop: from the archetypes we've identified in the qualitative, which of them actually resonate the most? It feels more authoritative, more backed up by the data."
Fergus Navaratnam-Blair, VP Trends and Futures, NRG
Running WTP research: four operational checks
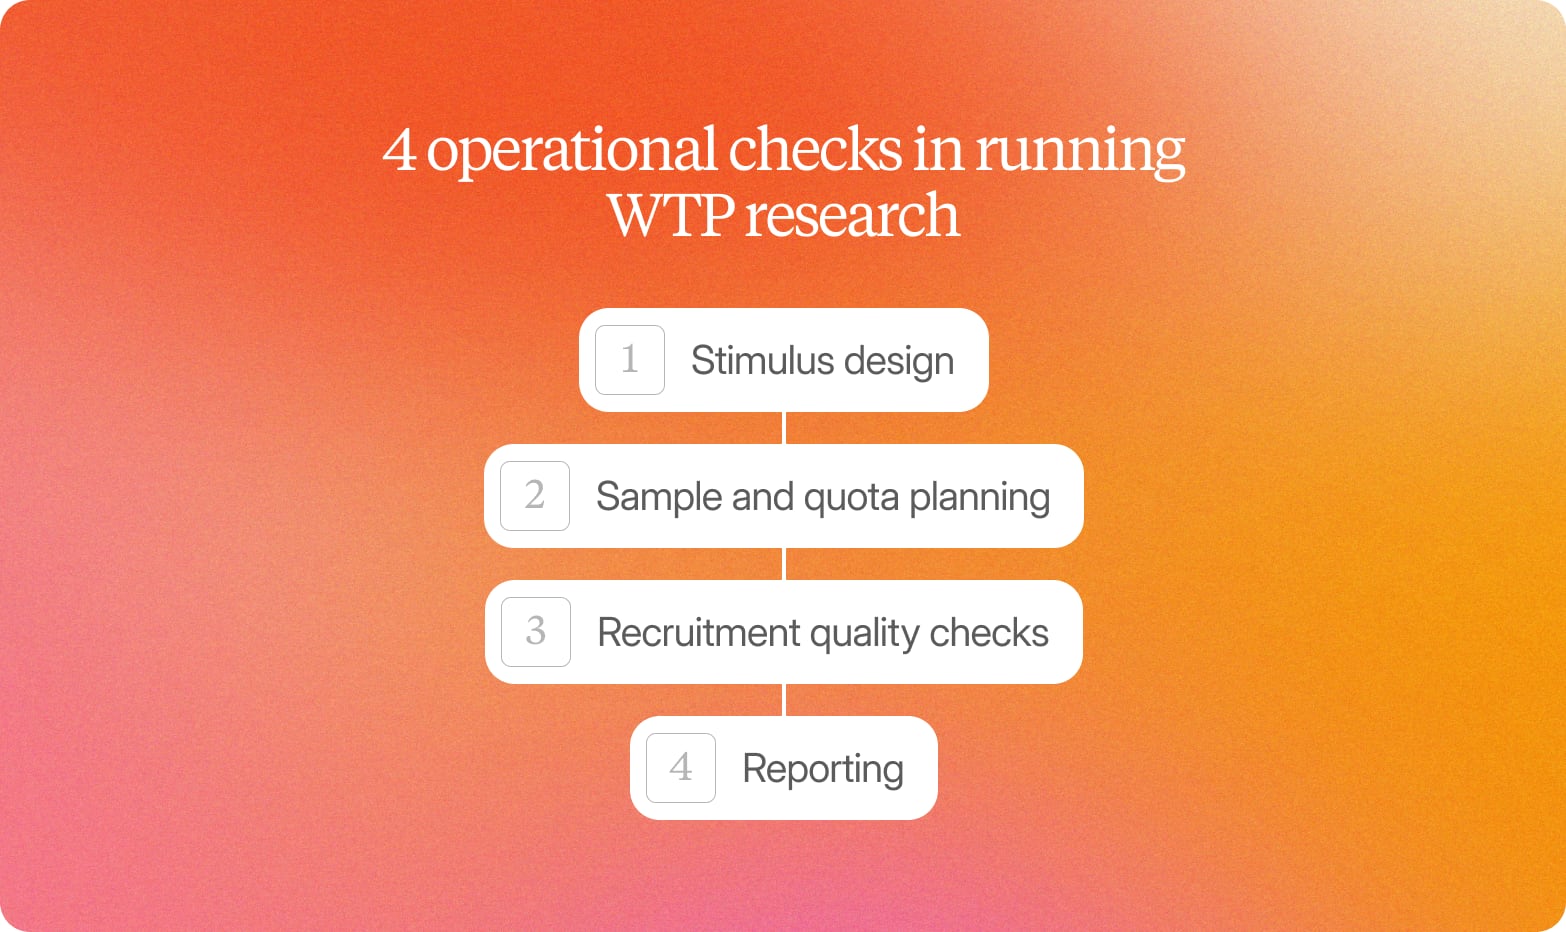
Stimulus design. A vague description inflates WTP; an overly detailed one turns the exercise into an execution check. Show your target customers a brief positioning statement, key benefit claims, and one or two use-context anchors. Randomize the order of price levels to prevent anchoring from the first figure shown.
Sample and quota planning. Quota on current category spend, involvement, and purchase authority. Mixing budget holders with influencers compresses the WTP range and hides the segment differences pricing decisions depend on. Different demographics matter less than purchase role, so in a CPG study, the split is based on pack format bought and retailer shopped. As a working rule, plan for 20 to 30 completed interviews per customer segment to achieve thematic saturation.
Recruitment quality checks. Screen on demonstrated behavior. Ask what a participant last paid for a comparable product. Intent questions about your category invite the answer you want to hear. That filters out potential customers who match your target audience on paper but have never bought in that category, and it is the cheapest way to build credibility into the dataset before analysis starts.
Reporting. Trace every claim about a customer's WTP to a timestamped clip and verbatim quote. Organize clips by customer segments and price threshold so stakeholders can verify the evidence themselves.
Multi-market research: Why WTP varies depending on the market
Multi-market work fails in predictable ways, and most stay invisible until a price lands badly in one region and costs you new customers there. Four factors each need a deliberate control.
| Failure mode | What goes wrong | The control |
|---|---|---|
| Translation | "Value for money" carries different connotations across languages, and a phrase that reads as neutral in English can read as leading in German | Back-translation reviewed by a native-speaking researcher, not a vendor checking grammar |
| Cultural price perception | A higher price signals prestige in some markets and unfairness in others, so the consumer's WTP shifts with what price signals locally | Anchor stimuli to locally familiar product categories before showing the concept |
| Currency framing | Foreign currency, or a conversion rate participants do not recognize, distorts responses | Local currency at a locally plausible price point, not a converted home-market figure |
| Regional reference prices | Without knowing what participants already pay locally, you cannot determine whether a figure is high, low, or typical | A warm-up question on current category spend before any price stimulus |
Consumer willingness to pay in one market is not a proxy for that in another, even within the same region.
How to present WTP findings
Findings stall in the room because stakeholders argue about what the numbers mean. Make every claim checkable, in three layers:
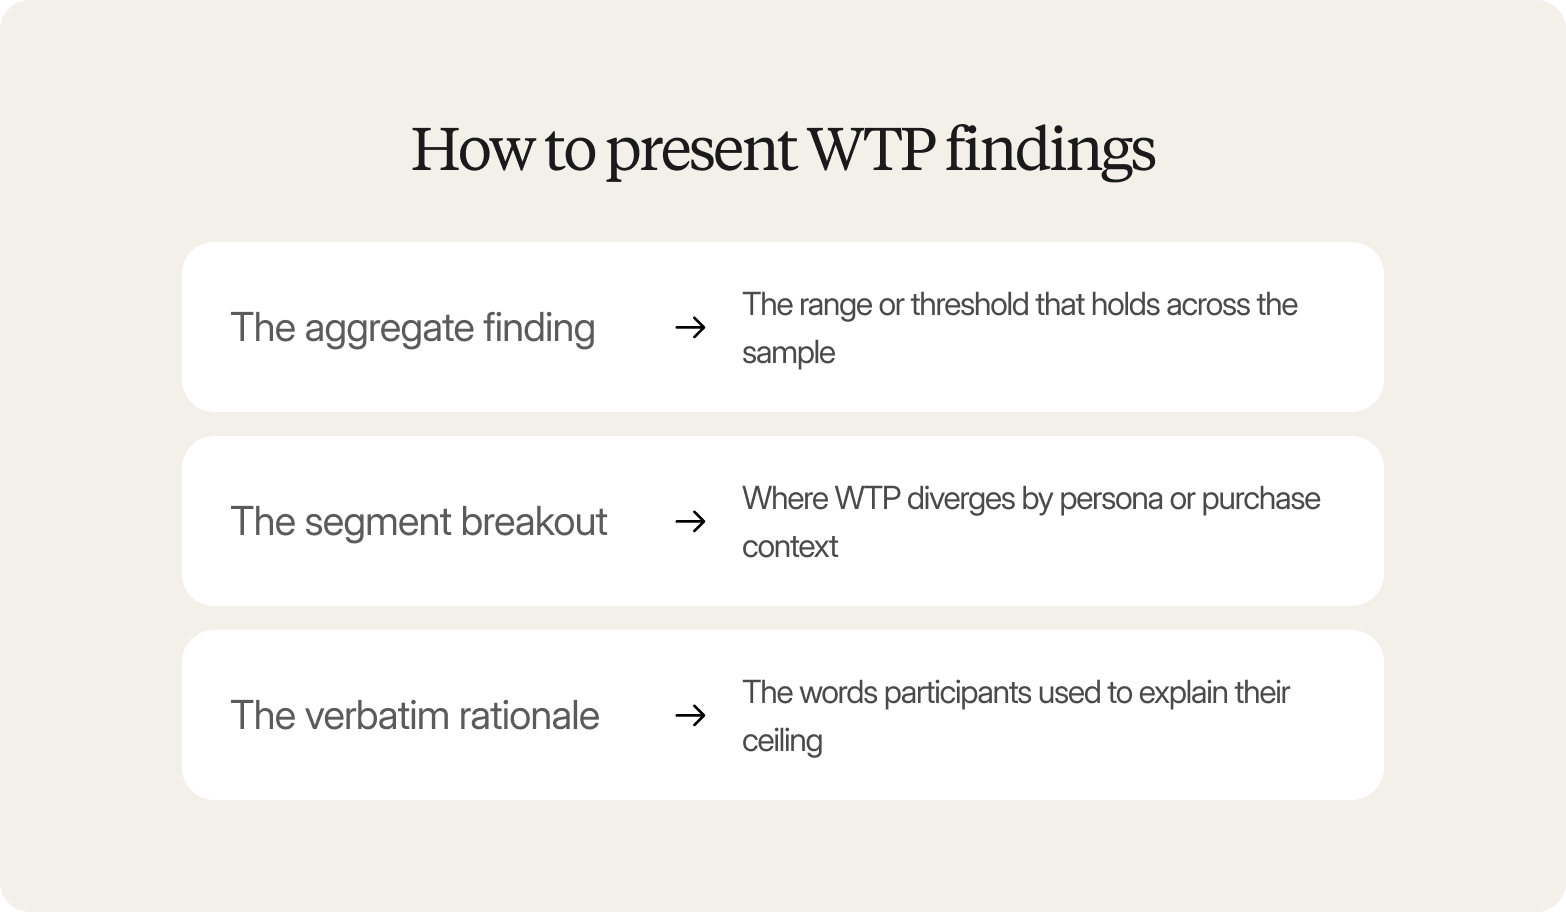
The aggregate finding. The range or threshold that holds across the sample.
The segment breakout. Where WTP diverges by persona or purchase context, and which customer segments hold the highest willingness to pay.
The verbatim rationale. The words participants used to explain their ceiling.
The third layer is where most readouts fall short. A number in a slide can be questioned. A shopper on camera saying "above $6 I'd put it back and take the own-brand" (example wording, not a study verbatim) is harder to dismiss. Building credibility that way shifts the conversation from "do we believe this?" to "what do we do about it?"
Watch the walkthrough: reading a Conveo report, and how insights are packaged for decision makers.
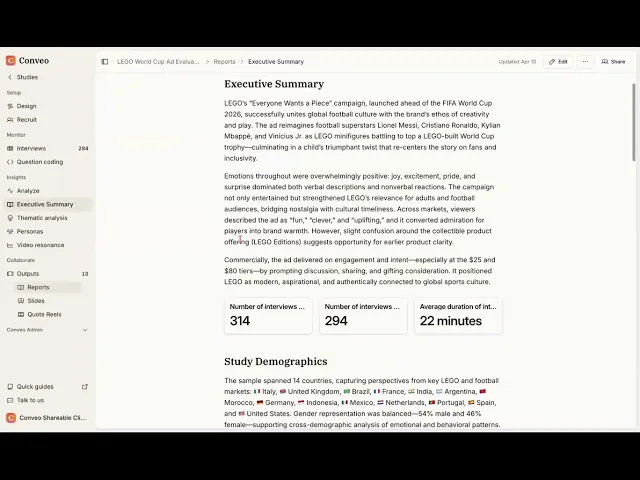
Two guardrails belong in any readout. Present ranges and name the directional bias. And lead with the segment view: average WTP hides the business decisions you actually need to make, so name the common factors behind a low ceiling and identify which segment holds the lower willingness to pay before it quietly sets the price for everyone.
Where Conveo fits in a WTP study
Run your Van Westendorp, Gabor-Granger, or conjoint exercise as you normally would, then use Conveo's AI research assistant to add the probing layer in the same participant pool. You get the stated number and the reasoning behind it from the same person, in the same session, one study instead of two run weeks apart.
The conditions participants attached to each price stay in the searchable insight library, so the next pricing round starts from what consumers already told you instead of a fresh discount guess.
Frequently Asked Questions
What is the meaning of willingness to pay?
Willingness to pay (WTP) is the maximum amount a customer is prepared to pay for a product or service before choosing not to buy. It marks the upper boundary of an acceptable price range. Because a customer's willingness to pay varies by individual, context, and economic conditions, researchers express it as a range across a target audience.
How do you measure willingness to pay?
Measuring customers' willingness to pay usually combines a quantitative method with a qualitative layer. Van Westendorp maps an acceptable range, Gabor-Granger produces a demand curve, and conjoint values individual features. Market research surveys deliver the figure; AI-moderated interviews deliver the conditions attached to it. To calculate willingness to pay defensibly, you need both, which is what holds up in front of a pricing committee.
What is the willingness to pay formula?
There is no universal formula, because WTP captures human preference. In practice, there are multiple ways to calculate WTP: aggregating price thresholds from sensitivity surveys, estimating WTP from conjoint utilities, or fitting a demand curve. The output is a distribution shaped by various factors, and the exact willingness to pay of any one buyer stays unobservable.
What is willingness to pay in economics?
WTP is a core concept in consumer theory, linked directly to the demand curve. Each point on a market demand curve represents the price at which a given buyer would purchase. Consumer surplus is the difference between the consumer's WTP and the market price they actually pay. In an English auction, the good clears at the highest bidder's ceiling price, one of the few settings where WTP is revealed rather than stated. A second-price format clears at the runner-up bid.
What is the difference between willingness to pay and willingness to accept?
WTP is the maximum amount a buyer is willing to spend to acquire something. Willingness to accept (WTA) is the minimum a seller will take to give it up. In theory, the two should be close for equivalent goods; in practice, WTA runs consistently higher, a gap attributed to loss aversion and the endowment effect. Any transaction settles between the two, which is why an English auction closes where the highest bidder meets the seller's floor.
What is a willingness to pay example?
A shopper is willing to pay up to $6 for a premium yogurt multipack. At $4.50, they buy and gain $1.50 in consumer surplus; at $6.50, they take the own-brand instead. Commercially, a personal care brand might test three price levels across its customer segments and find that the large pack carries a higher WTP per use than the single pack, with the highest willingness to pay in households that buy the category weekly. A SaaS company runs the same exercise across plan tiers.

About the author
Dieter De Mesmaeker
Co-Founder & CEO
Dieter is CEO and co-founder of Conveo. Before starting the company, he founded DataCamp and scaled it into one of the leading edtech platforms in the world.
More by Dieter →Qualitative insights at the speed of your business.
Conveo runs AI-moderated video interviews and structures everything they say.