


TL;DR
Quantitative user research measures what users do at scale, but behavioral metrics cannot explain why behavior diverges from expectations before the next sprint ships.
Session analytics, funnel data, and usability benchmarks tell product teams where experience breaks down; they rarely explain why or what to change.
Closing the loop between qualitative and quantitative approaches within the sprint cycle requires qualitative follow-up that moves at product speed, not agency timelines.
AI-moderated video interviews now make same-sprint qual follow-up possible, turning quantitative findings into explained, actionable insights before the next planning session.
Sprint planning is on Thursday. On Monday, analytics show a 15% drop in task completion on the onboarding flow your team shipped two sprints ago. The quantitative data is clear. The explanation is not.
Traditional qualitative follow-up takes 6 to 12 weeks. By the time the insight arrives, three more sprints have shipped on top of the original decision. The team has already moved on, built on assumptions, and compounded the uncertainty.
This is the structural problem with quantitative UX research in modern product development. It is not that quant lacks value. Behavioral metrics are continuous, and sprint cycles are short, whereas traditional qualitative explanations are periodic and slow. Quantitative UX research differs from qualitative follow-up in one critical way: quant tells you what changed, while qual tells you why. Treating those as sequential steps, at sprint speed, means the second step almost always arrives too late to matter.
This article covers what quantitative user research measures well, where it breaks down structurally, and how closing the quant-to-qual loop within the sprint cycle turns behavioral data into decisions that product teams can actually defend.
What Is Quantitative User Research
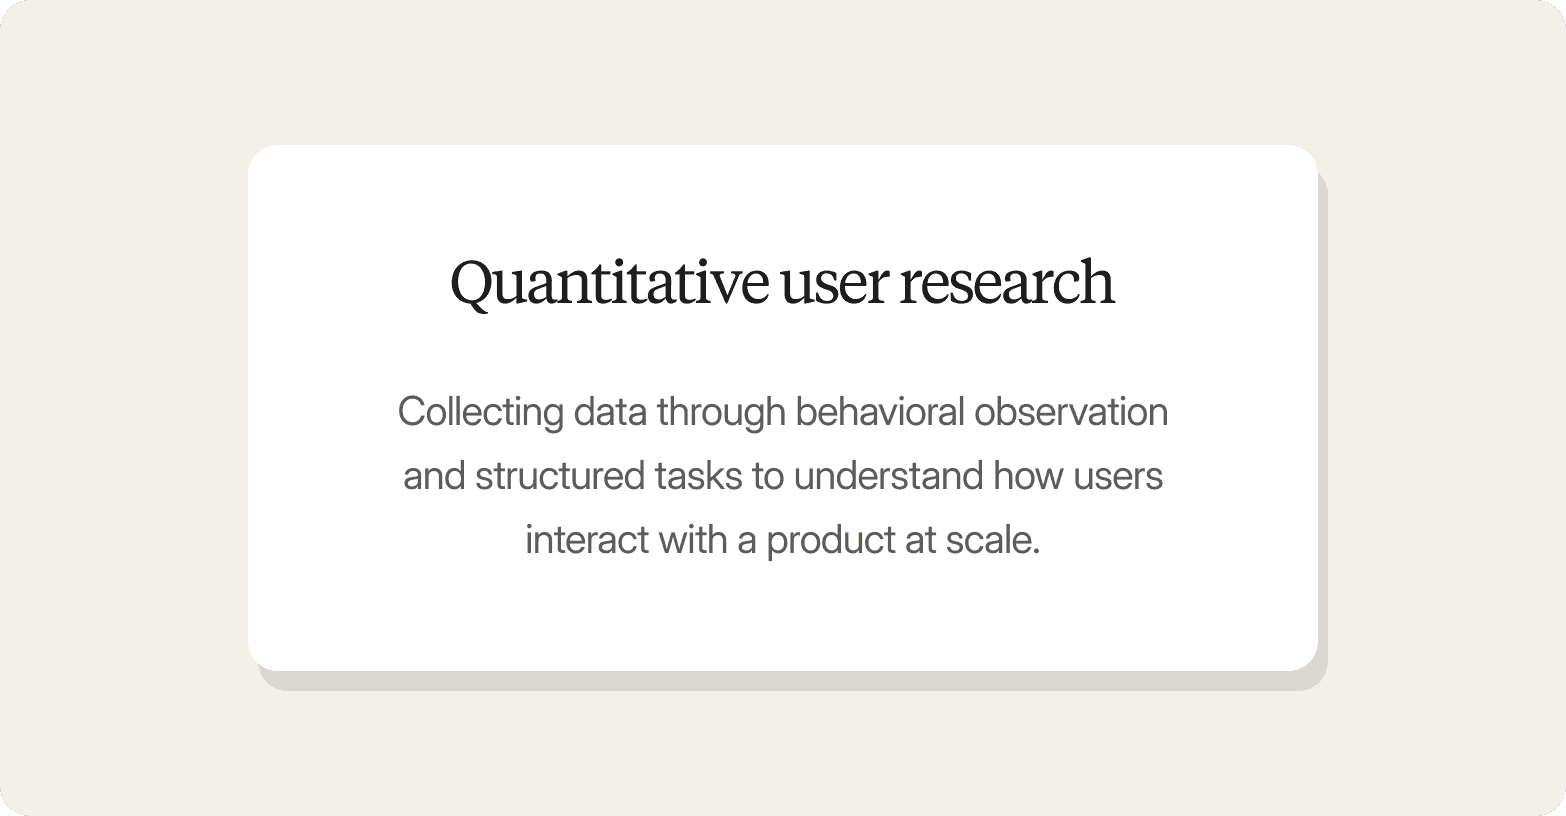
Quantitative user research involves collecting data through behavioral observation and structured tasks to understand how users interact with a product at scale. Rather than exploring individual reasoning, it produces numerical data and measurable data: task completion rates, error frequencies, SUS scores, click-through rates, funnel drop-off percentages, and retention curves.
The value is scale and objectivity. Quantitative UX research produces objective data that can be tracked over time, compared against an industry baseline, and used to prioritize which flows need redesign investment. Funnel analytics show exactly where users exit a checkout sequence without requiring any moderation. Session recordings surface friction patterns across thousands of sessions without the observer effect that colors in-person usability tests. Where qualitative data explores individual reasoning and motivation, quantitative data establishes patterns across a broader audience at a scale that individual interviews cannot match.
The limitation is behavioral. Quantitative user research tells you what users did; it cannot tell you why. A drop in completion rate from 78% to 63% is a clear signal that something changed. It provides no mechanism for explaining whether users were confused by a new UI element, deterred by a policy change, or encountered a bug in a specific browser. Behavioral data is a retrospective description of decisions already made, not an explanation of the intent behind them. Understanding user behavior at that level of depth requires qualitative research methods alongside the quant.
Quantitative UX Research Methods (And Where Each Breaks Down)
When conducting quantitative UX research, product and UX teams draw on a consistent toolkit of approaches to collect data on user behavior. Each is a legitimate part of any research methodology. Each also has a ceiling when the research question shifts from "what happened" to "why, and what should we change.
Method | Best for | UX limitation |
Session recordings and heatmaps | Identifying friction clusters, scroll depth, and rage clicks | Shows where users behave unexpectedly; cannot explain whether the issue is confusing UI, unclear copy, or wrong expectations |
System Usability Scale (SUS) | Usability benchmarking against an industry baseline | Produces a score, not a diagnosis; a SUS of 62 does not tell a designer which elements drove the perception of poor usability |
Task completion rate and error rate | Quantitative usability testing with structured tasks | Quantifies failure; does not explain whether users misunderstood the instruction, the interface, or the underlying mental model |
Funnel analytics | Identifying where users exit multi-step flows (onboarding, checkout, activation) | Shows the exit point; does not explain whether users quit because of intent, confusion, distraction, or a technical failure |
Retention cohort analysis | Tracking how user engagement changes over time by acquisition cohort | Shows that retention dropped; rarely explains which product change, lifecycle event, or user segment drove the shift |
A/B testing and multivariate testing | Comparing two or more variants at sufficient traffic volume to measure statistical significance | Produces a winner; does not explain why the winning variant performed better, making it hard to generalize the learning |
Tree testing | Measuring how easily users can find information within a navigation structure | Quantifies findability; does not explain why users took incorrect paths or what mental model they were following |
All seven methods answer "what" with precision. They struggle with "why," and in UX research, the "why" is almost always what determines what to build next. A systematic analysis of user actions is the starting point, not the destination. The quantitative UX researcher's job is to know when quantitative metrics have reached their explanatory ceiling and when qualitative UX research methods need to take over.
"It picks up on the nuances a survey never could."
— CMI Lead, Edgard & Cooper
Why Quant UX Signals Expire Before Teams Can Act
The sprint-cycle problem is not a data quality problem. It is a timing problem.
Product teams operate on two-week cycles. Quant signals arrive continuously: analytics data updates in real time, SUS scores come back within days of a usability study, A/B test results reach statistical significance within weeks. The decisions those signals should inform are made during sprint planning sessions, design critiques, and roadmap prioritization meetings. All of them run on fixed schedules that do not wait for a qualitative explanation.
Traditional qualitative follow-up takes 6 to 12 weeks. A UX research team that identifies a meaningful drop in feature adoption on a Monday cannot commission user interviews, recruit participants, moderate sessions, transcribe recordings, and interpret data in time for Thursday's sprint planning. So teams do one of two things:
Wait and lose the window. By the time the qual insight arrives, two or three more iterations have shipped on top of the decision it was meant to inform.
Ship on assumption. Product bets are made on reliable data that was never fully explained.
Consider a common scenario: a product team ships a redesigned activation flow in sprint 12. Session analytics show task completion drops from 74% to 58% in week two. The team debates in sprint planning: Is this a UI clarity problem? A copy problem? An expectation mismatch? They ship a copy variant in sprint 13 based on a hypothesis they cannot verify. The copy variant has no measurable effect. By sprint 14, they are two sprints removed from the original signal with no more explanatory power than they had on day one.
This is the structural gap. Quantitative UX research is designed to catch signals and track user behavior at scale. It has no mechanism for explaining them within the decision window that matters.
When Quant UX Research Fits (And When It Doesn't)
When quant fits
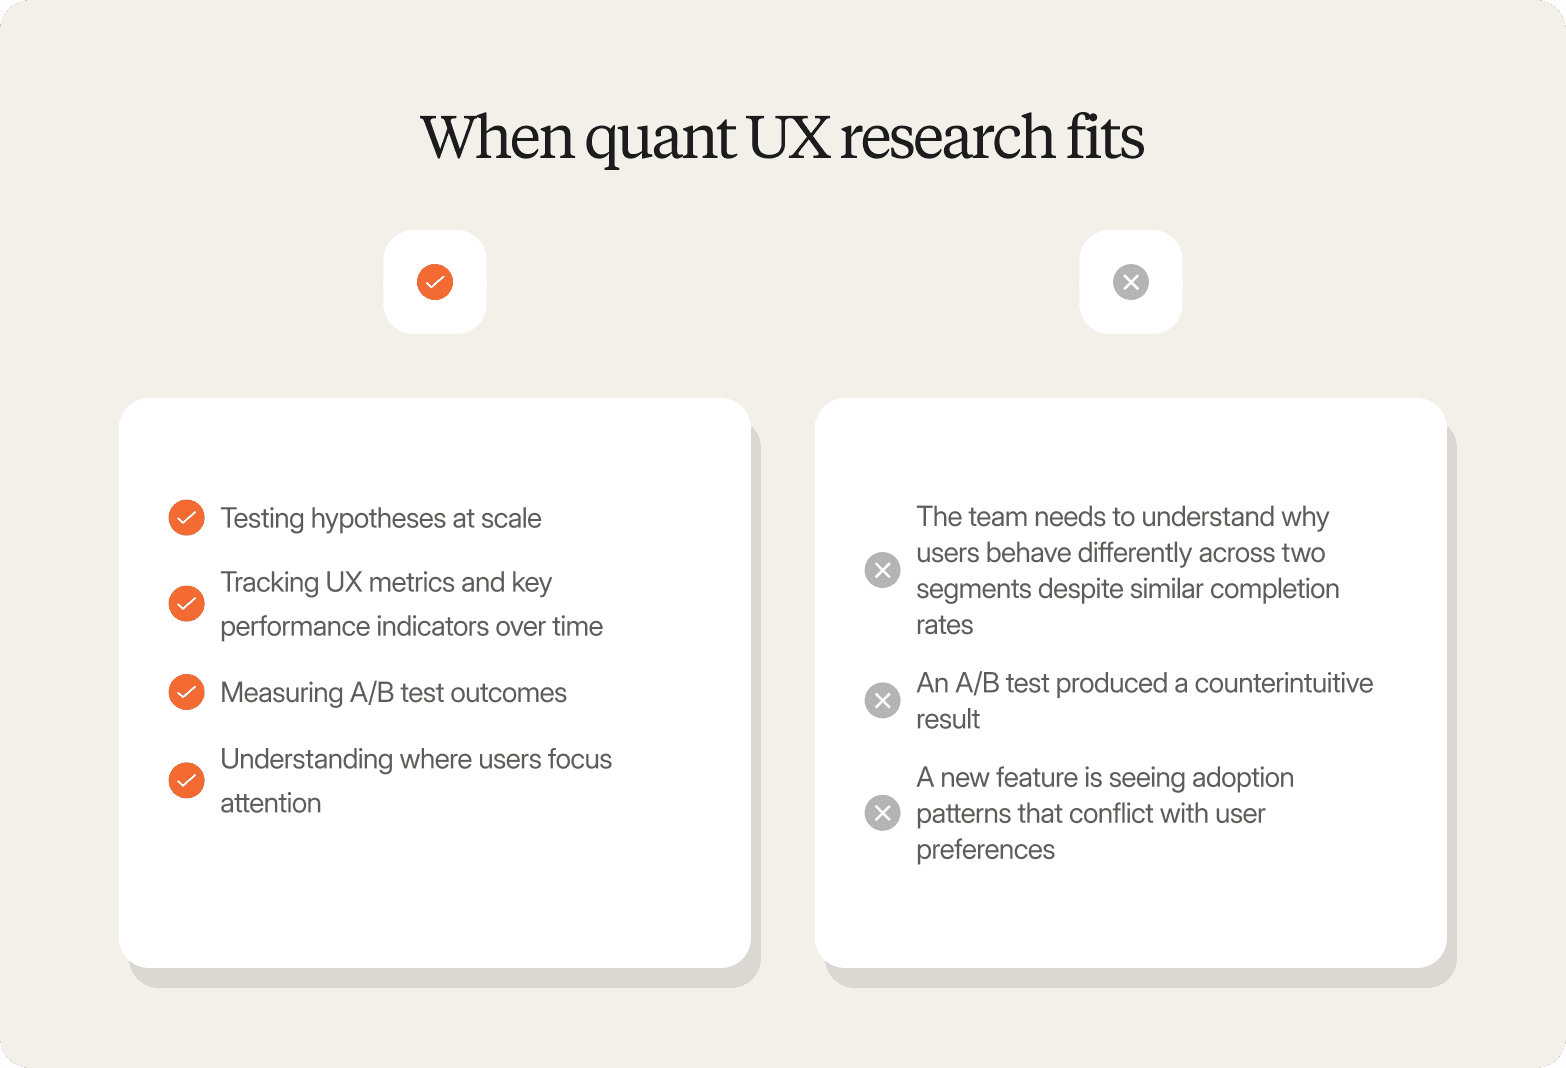
Quantitative user research earns its place when the research question is closed, the sample size is large enough to achieve statistical significance, and the team needs measurement rather than explanation. Conducting quantitative UX research works well for:
Testing hypotheses at scale: "Did the redesigned onboarding flow improve task completion?"
Tracking UX metrics and key performance indicators over time: "Is our SUS score improving across releases?"
Measuring A/B test outcomes: "Which variant produced higher click-through to the upgrade prompt?"
Understanding where users focus attention: "How many users exit the checkout sequence at step three?"
When the question is "how many users completed this," "what percentage dropped off," or "which variant won," quant research is the right instrument. It produces valuable quantitative data that informs product decisions, communicate progress to stakeholders, and creates a feedback loop between shipping and learning. In UX quantitative research, measurement is the mechanism that makes product bets defensible.
When quant doesn't fit
Quant breaks down the moment the research question becomes explanatory. Avoid leading with quantitative methods when:
The team needs to understand why users behave differently across two segments despite similar completion rates
An A/B test produced a counterintuitive result, and the team needs to understand what drove it before generalizing the learning
A new feature is seeing adoption patterns that conflict with user preferences, and the team needs to know whether the problem is discoverability, mental model mismatch, or value proposition
Treating the absence of signal as confirmation of the hypothesis is one of the most common ways product teams misuse objective data. A flat SUS score across two releases is not evidence that user experience has stabilized. A completion rate that holds while session recordings show increasing friction is not a clean bill of health.
Qualitative and quantitative UX research answer different questions. If your question is "how many" or "what rate," quant fits. If it is "why did this happen" or "what should we change to fix it," then qualitative UX research methods and qualitative data should be in the loop before the next sprint ships.
How AI-Moderated Qual Closes the Sprint-Cycle Loop
For most of the history of UX research, speed was the tradeoff. Deep qualitative insight required recruiting participants, scheduling sessions, moderating interviews, and synthesizing transcripts (a process measured in weeks, not days).
That constraint is dissolving. Qualitative research is entering a new phase of capability, where the depth that made it irreplaceable is no longer in tension with the speed product teams demand. Qualitative and quantitative approaches can now be conducted within the same sprint window, rather than in separate research cycles that take months to complete. AI-moderated video interviews run participant sessions in parallel, probe adaptively when responses surface unexpected reasoning, and return synthesized qualitative feedback within days, fast enough to inform a sprint decision before planning closes.
Conveo is built for this workflow. When funnel analytics flag a drop in an activation flow on Monday, a Conveo study can be deployed the same day. Participants complete async video sessions on their own schedule: no calendar coordination, no recruiter overhead, no moderation queue. The AI moderator probes each user on the specific behavior the quant flagged: "You stopped at step three of the setup flow. What was going through your mind at that point?" When a user's response surfaces an expectation mismatch, the moderator follows up: "You expected the integration to connect automatically. What made you think it would work that way?" The follow-up is adaptive, not templated, aiming for a deep understanding of user intent rather than a surface-level description of what happened.
By Wednesday, the team has 20 to 30 explained behavioral observations, each linked to a verbatim video clip. Sprint planning on Thursday has a qualitative foundation, not just a metric anomaly.
Two structural advantages make this practical:
Async participation. Product users rarely block calendar time for scheduled sessions. Unlike focus groups, ethnographic research programs, or traditional moderated interviews requiring in-person coordination, Conveo sessions run on participants' own schedules, solving the recruitment bottleneck that makes traditional qual impractical at a sprint pace.
Traceability. Findings link to video clips, giving stakeholders the evidence they need to trust and act on an insight rather than debate whether the research was representative.
When quantitative UX research shows a drop in completion rate or a spike in error rates, teams now have a viable path to an explanation within the same decision window. The quant UX researcher who identifies a triggering metric on Monday can have a mixed-methods picture (quantitative signal plus qualitative explanation) by Wednesday. That is a workflow shift that determines whether research influences product decisions or arrives too late to matter.
See it in action: How Conveo's AI moderator probes the behavior behind your quant signal →
Examples of Quantitative User Research in Practice
The following examples cover the study types product and UX teams most commonly run when conducting quantitative UX research, with the method, research question, and output for each.
Study type | Method | Research question | Output |
Activation flow audit | Funnel analytics + session recordings | Where are users exiting the onboarding sequence, and are there visible clusters of friction at those exit points? | Exit rate by step; heatmap overlays identifying rage-click and dead-click zones |
Usability benchmark | SUS + task completion rate | Has perceived usability improved across the last two releases, and is user performance on core tasks within expected time-on-task thresholds? | SUS score trend, completion rate, and error rate by task and user segment |
Feature adoption tracking | App analytics and data analytics platforms (Mixpanel / Amplitude / Google Analytics) | Which user segments are engaging with the new feature, and at what cadence? | Adoption rate by cohort, segment, and acquisition source |
A/B and multivariate testing | Variant testing with statistical analysis | Which version of the upgrade prompt produced higher conversion to paid, and was the result statistically significant? | Conversion rate by variant, confidence interval, and required traffic volume |
Each of these study types produces clear quantitative metrics. What none of them produce is an explanation of the intent behind the behavior they measured. Funnel analytics can show where users exit; they cannot explain whether users quit because they were confused, unconvinced, or simply interrupted. Data analytics platforms can identify patterns in adoption; they cannot explain what drove those patterns. That explanation determines whether the team's response to the signal is correct.
Designing QUR Studies That Inform Sprint Decisions
The design challenge in quantitative user research is not methodological. It is temporal. Most quantitative research methods are well-designed for the question they answer. The problem is that product teams need the answer and the explanation within the same decision window.
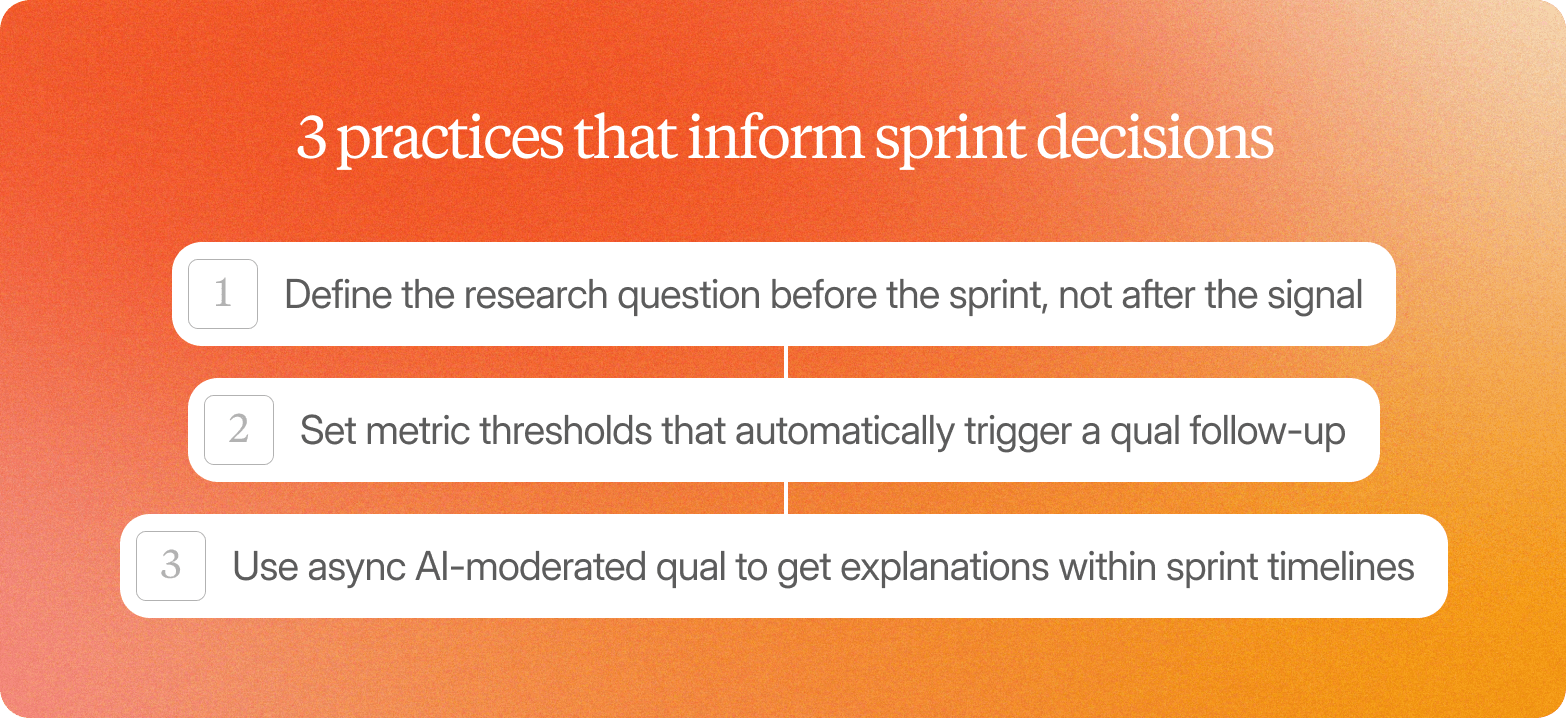
Three practices close that gap in sprint-aligned research methodology:
Define the research question before the sprint, not after the signal
The most common failure mode is reactive: a metric drops, the team scrambles to understand it, and the window closes before an explanation arrives. Research programs that define in advance which UX metrics will trigger qual follow-up, and at what threshold, can deploy qual faster because the infrastructure and question framing are already in place.
Set metric thresholds that automatically trigger a qual follow-up
A task completion rate that drops more than five percentage points, a SUS score that falls below 68, an A/B test where the losing variant underperformed by more than expected: these are triggering conditions, not just data points. Teams that treat them as automatic prompts for qualitative UX research methods close the loop systematically rather than on a case-by-case basis.
Use async AI-moderated qual to get explanations within sprint timelines
Traditional qualitative research methods cannot meet sprint deadlines. Async AI-moderated sessions can. When the infrastructure is in place, a team can go from a quant signal on Monday to synthesized qual findings by Wednesday, fast enough to inform Thursday's sprint planning.
Conveo's AI-moderated video interviews probe each participant on the specific behavior the quant flagged, follow up when responses surface unexpected reasoning, and synthesize across sessions to identify the dominant explanation pattern. A product team investigating a 14-point SUS drop after a navigation redesign can have 25 explained behavioral observations, each linked to a verbatim video clip, within 48 hours of deploying the study.
How Conveo Closes the Quantitative UX Research Loop
The gap between what quant measures and what product teams need to decide cannot be closed by adding more dashboards. It requires a qualitative explanation that arrives within the same decision window as the behavioral signal: before sprint planning, not after.
Conveo is built for that workflow. As a video-first AI research platform, it runs AI-moderated interviews asynchronously across participant groups, with each session completed on the participant's own schedule. The AI moderator probes adaptively, following up when a user's response surfaces reasoning that the quantitative data could not capture, and synthesizes findings across sessions to return explained behavioral observations, not just more data.
The operational advantages are structural:
No calendar coordination or recruitment lead time measured in weeks
Studies deploy within hours of a triggering metric; findings return within days
Video clips link every synthesis point back to verbatim participant testimony, giving stakeholders reliable data and the traceable evidence they need to act
Conveo's platform is SOC 2 certified and supports enterprise procurement requirements, including EU data hosting and SSO. 93% of participants rate the experience 4 out of 5 or higher, and sessions produce 3 to 4 times as much content as traditional interview formats, giving quant UX researchers greater explanatory depth from each participant.
For UX researchers and product teams conducting quantitative UX research today, the practical next step is not to replace quant. It is to close the loop within the sprint cycle and build a genuine understanding of user behavior, rather than waiting for the next research wave.
Frequently Asked Questions
What is the difference between quantitative and qualitative user research?
What sample size do you need for quantitative user research to be statistically valid?
How do you close the loop between quant metrics and user behavior explanations within a sprint cycle?
What are the most commonly used quantitative user research tools?
How long does quantitative user research typically take from study design to results?

