In this article
TL;DR
The Van Westendorp price sensitivity meter maps an acceptable price range from four questions, but that range only holds if participants are pricing the product you think they are.
The method never checks. It records consumer price perceptions without revealing what reference set produced them, so buyers hesitate for reasons the four questions never surface.
Establish what participants currently buy and what they pay before asking what feels too expensive. That anchors the range to verified understanding and gives pricing strategy a defensible starting point.
Pricing calls rarely wait for perfect evidence. When a launch price needs defending, and no benchmark exists to anchor a structured test, the Van Westendorp price sensitivity meter is the method most teams reach for: four questions, a short field window, and a range you can put in front of stakeholders.
This guide covers how to run it, how to read the curves, where it fails, and what to add so the range describes the product you are launching.
What is the Van Westendorp price sensitivity meter?
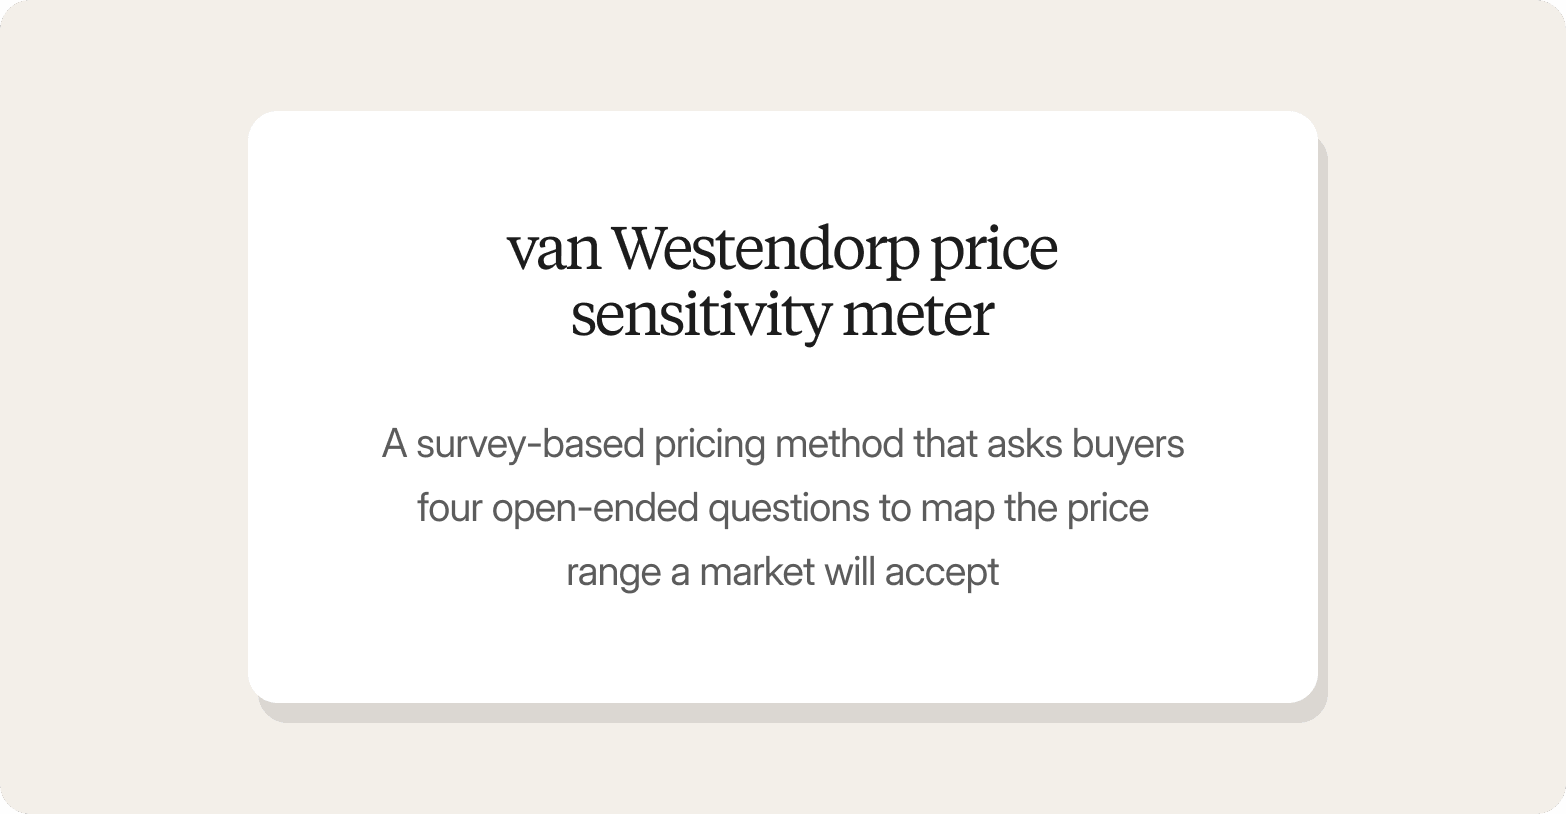
The Van Westendorp price sensitivity meter is a survey-based pricing method that asks buyers four open-ended questions to map the price range a market will accept. Developed by Dutch economist Peter van Westendorp in 1976, it remains one of the most widely used pricing strategy techniques in the market research industry: fast to field, no predefined price ladder, a structured output from four survey questions.
The four questions
| Question | Threshold it captures |
|---|---|
| "At what price would this product be so cheap that you would question its quality?" | The floor below which doubts about product quality set in |
| "At what price would this product be a bargain?" | The value sweet spot |
| "At what price would this product be getting expensive, but you would still consider buying it?" | The soft ceiling where hesitation begins |
| "At what price would this product be so expensive that you would not consider buying it?" | The hard ceiling buyers refuse to cross |
Wording varies; some field the third as "At what price would you consider this product to be getting expensive?" without changing what the Van Westendorp method measures. Because participants answer in their own words rather than reacting to prices chosen by the researcher, the Van Westendorp methodology avoids the anchoring bias that structured price ladders introduce.
What it produces
The output is a Van Westendorp graph of four cumulative response curves. Where they intersect, market researchers read off two numbers:
The Optimal Price Point (OPP): the price at which the same percentage of buyers call the product too expensive and too cheap.
The acceptable price range: the band within which most potential customers consider a purchase.
The method measures stated willingness to pay. It does not capture why a buyer draws that line.
How to run a Van Westendorp survey
Running Van Westendorp pricing in practice takes a tighter execution sequence than most templates suggest.
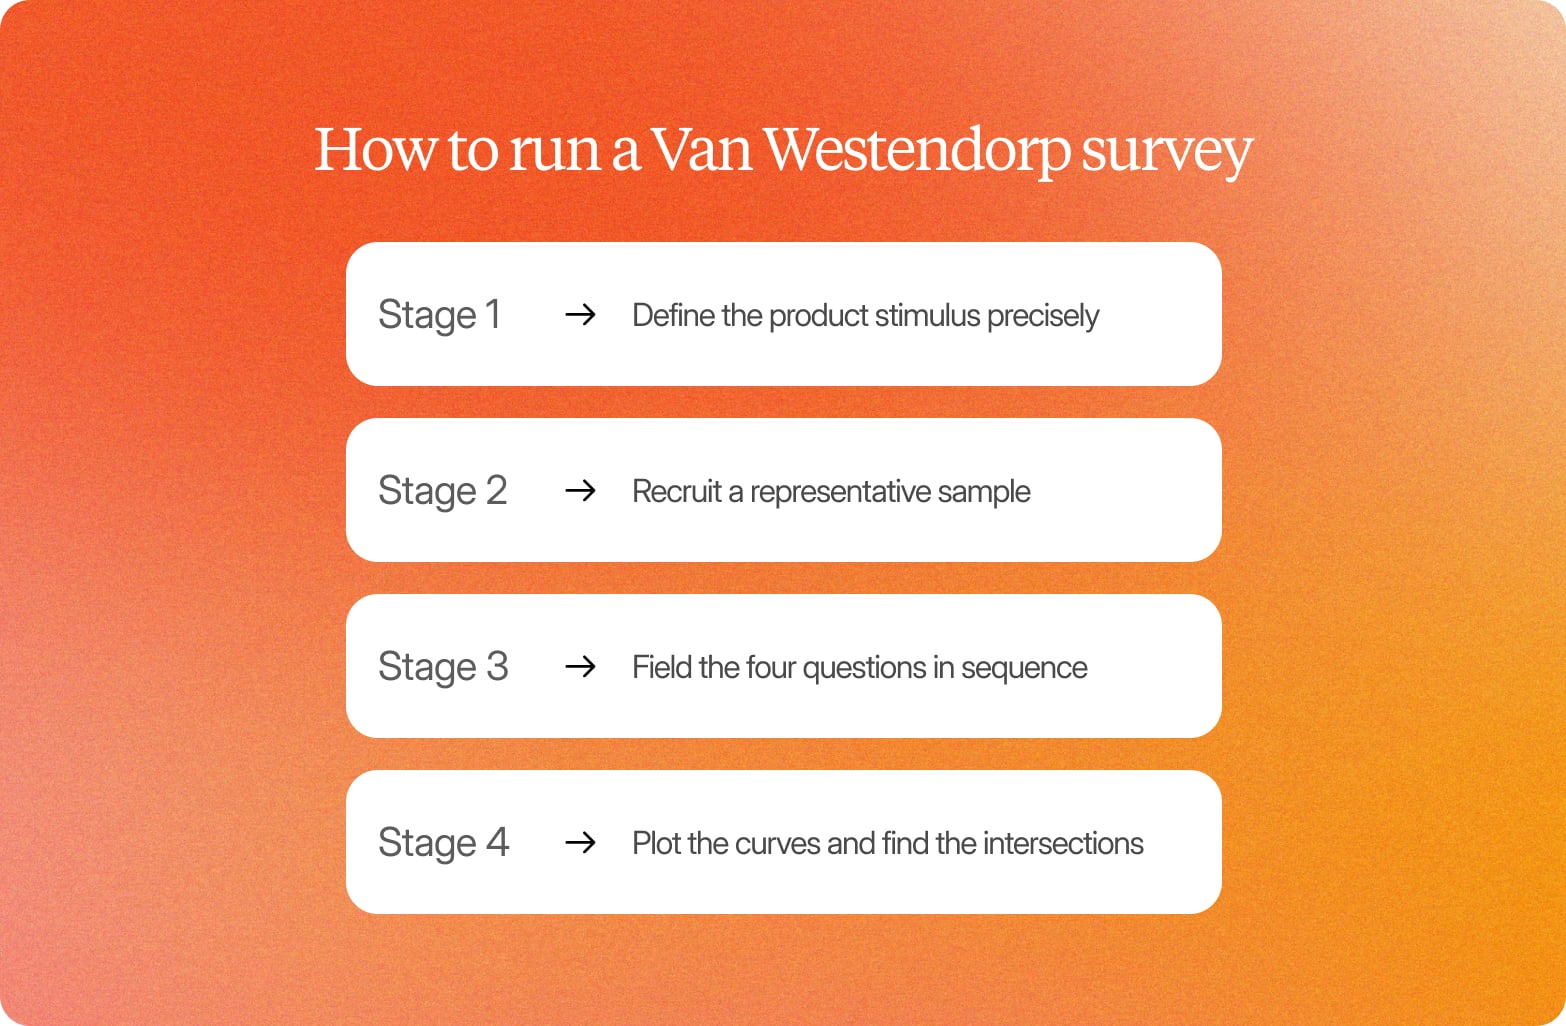
Step 1: Define the product stimulus precisely
Decide what participants are pricing and which target market is pricing it. Specify format, quantity, channel, and features. "A premium skincare serum" returns a different range than "a 30ml vitamin C serum, sold direct-to-consumer, with a 60-day money-back guarantee."
Step 2: Recruit a representative sample
The Van Westendorp pricing model needs participants who reflect the purchase population, so screen for category involvement, purchase recency, or decision-making authority. A general-population sample includes people who would never buy at any price, and their answers compress the range and misrepresent the target market.
Step 3: Field the four questions in sequence
The Van Westendorp methodology specifies a fixed order: too cheap, cheap but acceptable, expensive but acceptable, too expensive. Departing from it introduces anchoring effects that distort the curves. For multiple price or pack configurations, use monadic testing: one configuration per participant, sample split across cells.
Step 4: Plot the curves and find the intersections
Each question generates a cumulative frequency distribution. Plotted together, they reveal the acceptable price range and the optimal price point, where the same percentage of participants call the product underpriced and overpriced. Hence the name "line-crossing" approach: the answer lies where the curves meet.
Sample size guidance
| Analysis level | Minimum completes | Why |
|---|---|---|
| Total sample | 200 | Enough for stable curves and an accurate estimate at the total level |
| Per segment (region, income band, usage occasion) | 150 to 200 | Below this, curves move when only a handful of responses shift |
Where the method breaks down
Anchored wording. Phrases referencing price anchors, competitor pricing, or promotional framing bias responses toward the anchored figure.
Currency formatting. An unfamiliar format, or a denomination carrying cultural weight, resets price expectations before the first answer.
An ambiguous stimulus. The method treats direct customer input as a reading of a single shared, understood object and never verifies whether a participant's mental model matches the intended offer. Participants fill in the gaps themselves, and downstream clean market research data cannot fix it.
How to read Van Westendorp results
| Curve | Behavior as price rises | What it registers |
|---|---|---|
| Too cheap | Falls | Fewer people read the price as suspiciously low quality |
| Not cheap (inverse of the acceptably cheap response) | Rises | Fewer people treat the price as a bargain |
| Not expensive | Falls | Fewer people stay comfortable at the price |
| Too expensive | Rises | More people reject the price outright |
When plotted on a single Van Westendorp graph, with price on the x-axis and cumulative percentage on the y-axis, the curves produce four intersections.
| Intersection | Where the curves cross | What it tells you |
|---|---|---|
| Point of Marginal Cheapness (PMC) | "Too cheap" crosses "not cheap" | The lower limit of what the market tolerates. Below it, enough participants doubt quality to erode credibility |
| Point of Marginal Expensiveness (PME) | "Too expensive" crosses "not expensive" | The upper limit, where a high price becomes a prohibitively expensive one |
| Optimal Price Point (OPP) | "Too cheap" crosses "too expensive" | Where an equal share is perceived from either direction. Often reported as the ideal price, though it minimizes resistance rather than maximizing revenue |
| Indifference Price Point (IPP) | "Not cheap" crosses "not expensive" | The price participants perceive as typical for the category, a useful read on price expectations |
The corridor between PMC and PME is the acceptable price range, the primary strategic output of the Van Westendorp price sensitivity meter chart.
What the chart cannot tell you
Why buyers hesitate at the upper bound, or how customers feel as they name it
What value gap prevents them from accepting the PME
What evidence or framing would move that ceiling upward
The chart also reads as more precise than it is, because the intersections produce numbers that invite decisions.
Reference sets differ, too. An established product carries category norms a new format does not, and the Van Westendorp model captures those customer price perceptions without distinguishing a ceiling built on real value assessment from one built on unfamiliarity.
Why Van Westendorp surveys miss the "why" behind price resistance
Van Westendorp produces a price range. It does not explain why a number triggers "too expensive," or what would need to change for a participant to cross that threshold. The four questions follow a concept description, with no check to ensure the participant and the research team share the same definition of what is being priced. If a participant anchors to a different competitive tier than the team is targeting, every number they supply carries that misalignment, and the pricing analysis built on it inherits the error.
What that looks like in practice
A team tests a premium personal care product. The Van Westendorp price sensitivity meter indicates an acceptable range of $15 to $25, so the team prices within that range.
Post-launch, the product struggles. A follow-up conversation reveals that most participants had benchmarked the concept against mass-market alternatives at $8 to $12, because the description did not differentiate it from that tier. The range accurately reflected consumer price perceptions for the product participants believed they were pricing. For the intended premium positioning, it was the wrong range.
Fixing the reference frame
Before asking what price feels too expensive, establish what the participant buys today, what they pay, and what works or fails about it. That fixes the reference frame before competitor anchors can distort the output.
Video-based price conversations make those anchors visible in a way static surveys cannot. When a participant says "that's more than I pay for X," the team can see which competitive set is shaping the response and where the product sits in the competitive landscape.
"You see them physically doing it. Testing the product for the first time, being probed right there. That unfiltered, in-the-moment reaction is possibly the most powerful thing you can see as a researcher."
Dafydd Jones, Associate Director, Ninth Seat
How to anchor Van Westendorp ranges to verified understanding
The standard Van Westendorp pricing survey frames its four questions against an assumed understanding of the product. Two people can read the same concept description and price the offer with two different mental models, so teams end up setting prices within a range that is mathematically clean but behaviorally unreliable.
Conveo runs AI-moderated video interviews in a fixed sequence before any price questioning begins.
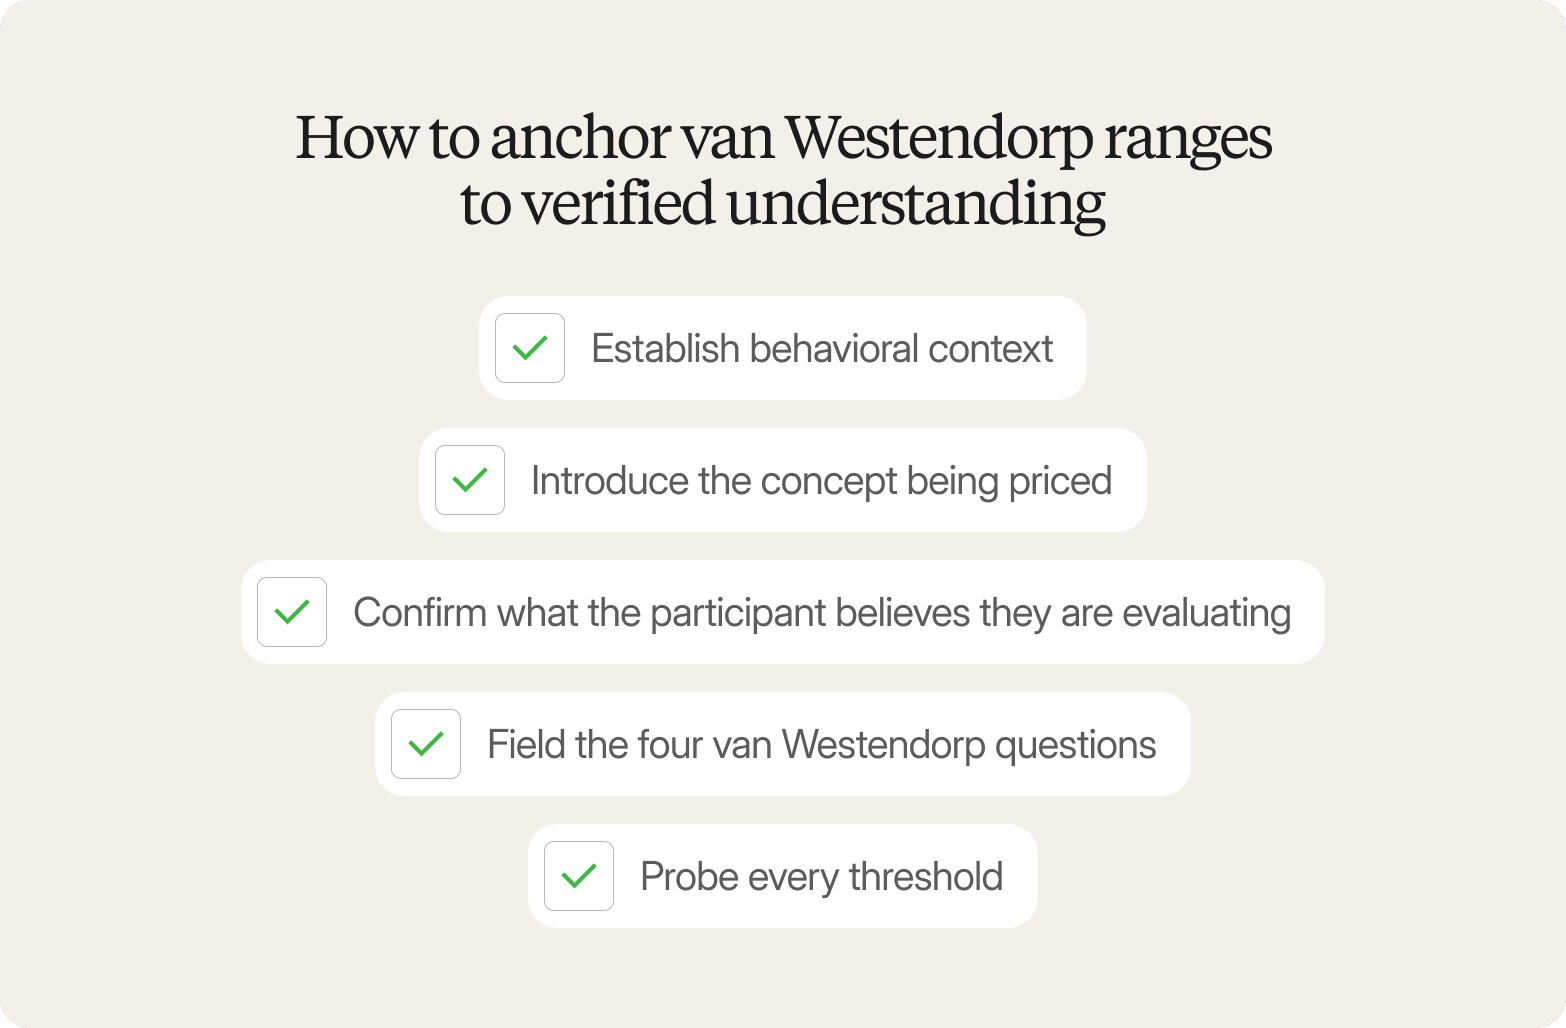
Establish behavioral context. What do you buy in this category, what does it cost, what works, and where does it fall short? This surfaces which products participants consider the competitive set and what they consider good value.
Introduce the concept being priced. Only once that baseline is on record, with enough detail to make evaluation concrete.
Confirm what the participant believes they are evaluating. Any gap from the intended concept is visible before it contaminates a price response.
Field the four Van Westendorp questions. The Van Westendorp method runs unchanged. What changes is what the participant is holding in mind when they answer.
Probe every threshold. What would make the higher price worth it? What is missing at that price point? What would need to change? This is where the value gap becomes a specific, named signal you can act on.
See it in action: how AI-moderated probing works in a live session.
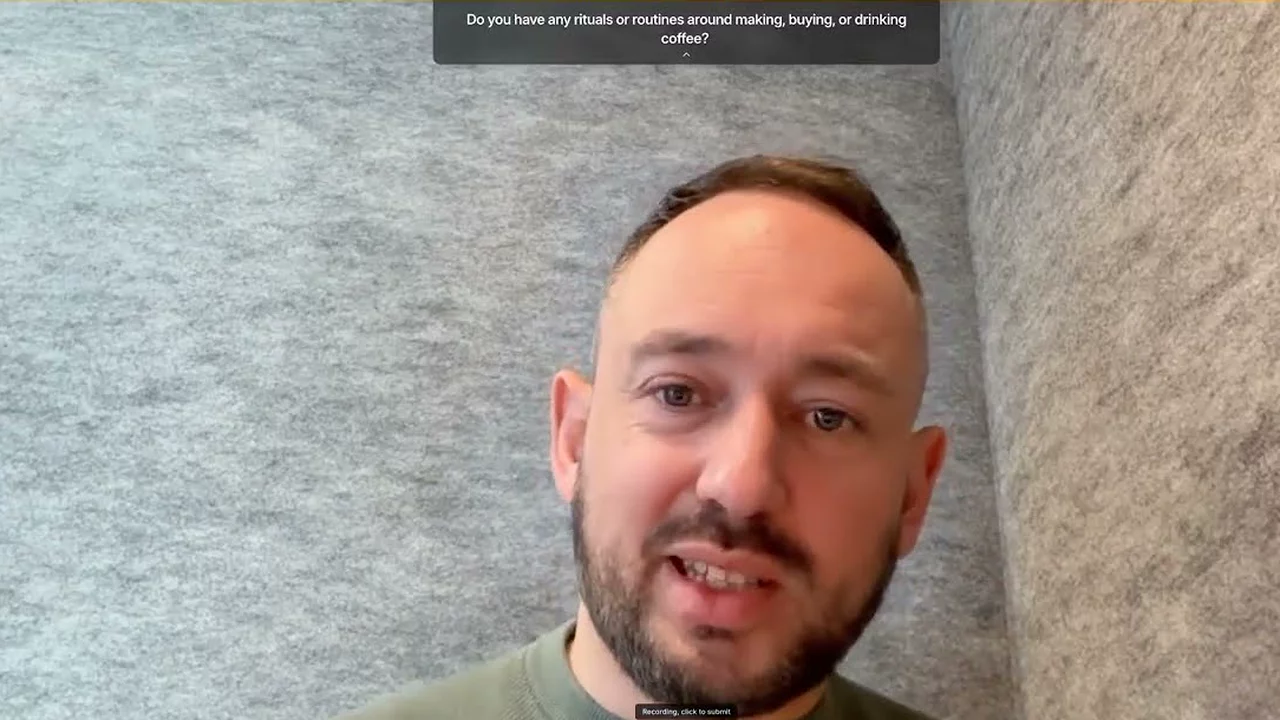
What video adds that survey data cannot
When a price triggers genuine resistance, participants pause, their tone drops, or their expression shifts before they have consciously decided how to respond. Those cues show how a participant feels about a number, as well as what they say about it. Someone who says "that seems reasonable" while their face registers doubt is a different data point from someone who says it without pausing.
The acceptable range is then anchored to a verified understanding of the offer, and every threshold traces back to a specific participant, moment, and reason.
When to use Van Westendorp (and when not to)
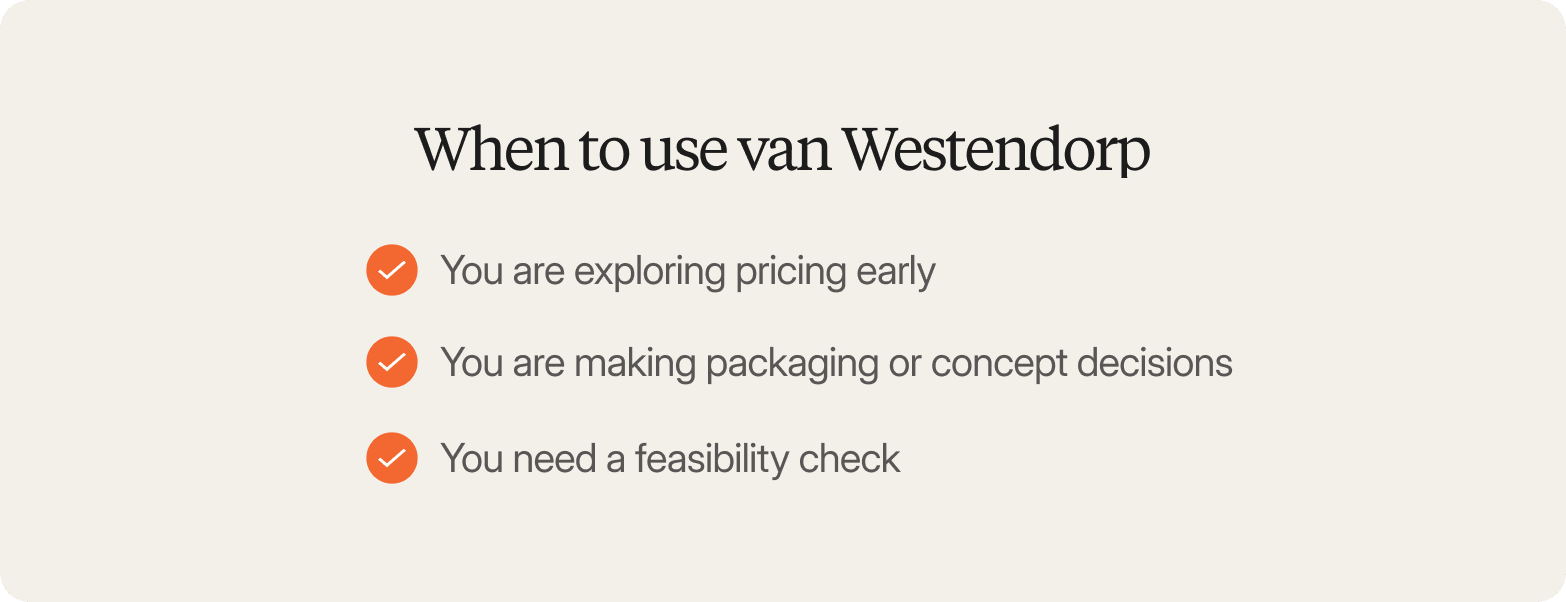
Use it when
You are exploring pricing early, with no existing price reference to anchor a more structured test.
You are making packaging or concept decisions, where the goal is an acceptable range rather than revenue optimization.
You need a feasibility check, where stated willingness to pay informs a go/no-go call.
In each case, the Van Westendorp methodology surfaces the perceptual floor and ceiling before any price is committed internally, keeping early work tied to strategic objectives rather than to a defended number.
It breaks down when
The product is unfamiliar. Someone pricing an established product calibrates "too cheap" from prior purchase experience. Someone facing a new format has no such reference, so their thresholds come from imagination more than judgment.
You need revenue optimization. The Van Westendorp pricing model maps the perceptual boundaries without showing how demand shifts inside them. Teams whose sales goals depend on volume at a given price need a demand curve instead.
You need causal understanding. The thresholds show where resistance appears without explaining why a price feels prohibitive.
Alternative and complementary methods
| Method | What it gives you | Use it when |
|---|---|---|
| Conjoint analysis | Feature-level trade-offs and willingness to pay at once | Price has to be evaluated alongside product configuration |
| Gabor-Granger | A direct price-demand curve from a sequence of different price points | You know the acceptable range and need the revenue-optimal point inside it |
| Monadic testing | Competitive context, shown alongside alternatives at different price levels | Shelf dynamics shape the purchase decision |
| Newton Miller Smith extension | A rough revenue projection from two purchase intent questions added to the four | You want a commercial read without a separate study |
The Newton Miller Smith extension, long established in the market research industry, adds purchase-intent ratings for bargain and high prices, providing a more accurate estimate of commercial outcomes. Purchase likelihood is still stated against whatever product the participant imagined.
Better still, run Van Westendorp inside an AI-moderated interview that collects the thresholds and the reasoning in one session, because on its own the method returns numbers without the reasons behind them. Ask someone who marks $18 as "too expensive" what crossed the line. Finding the right price is a judgment call, and that logic makes it defensible.
Van Westendorp execution playbook for multi-market studies
Running the Van Westendorp price sensitivity meter across multiple markets sounds routine until the first cross-country comparison falls apart. Currency formatting differs, norms around pricing transparency vary, and a reasonable "cheap" anchor in one market can sit above another market's "too expensive" threshold. The result is ranges that look comparable but are not, built on market research data that cannot be pooled.
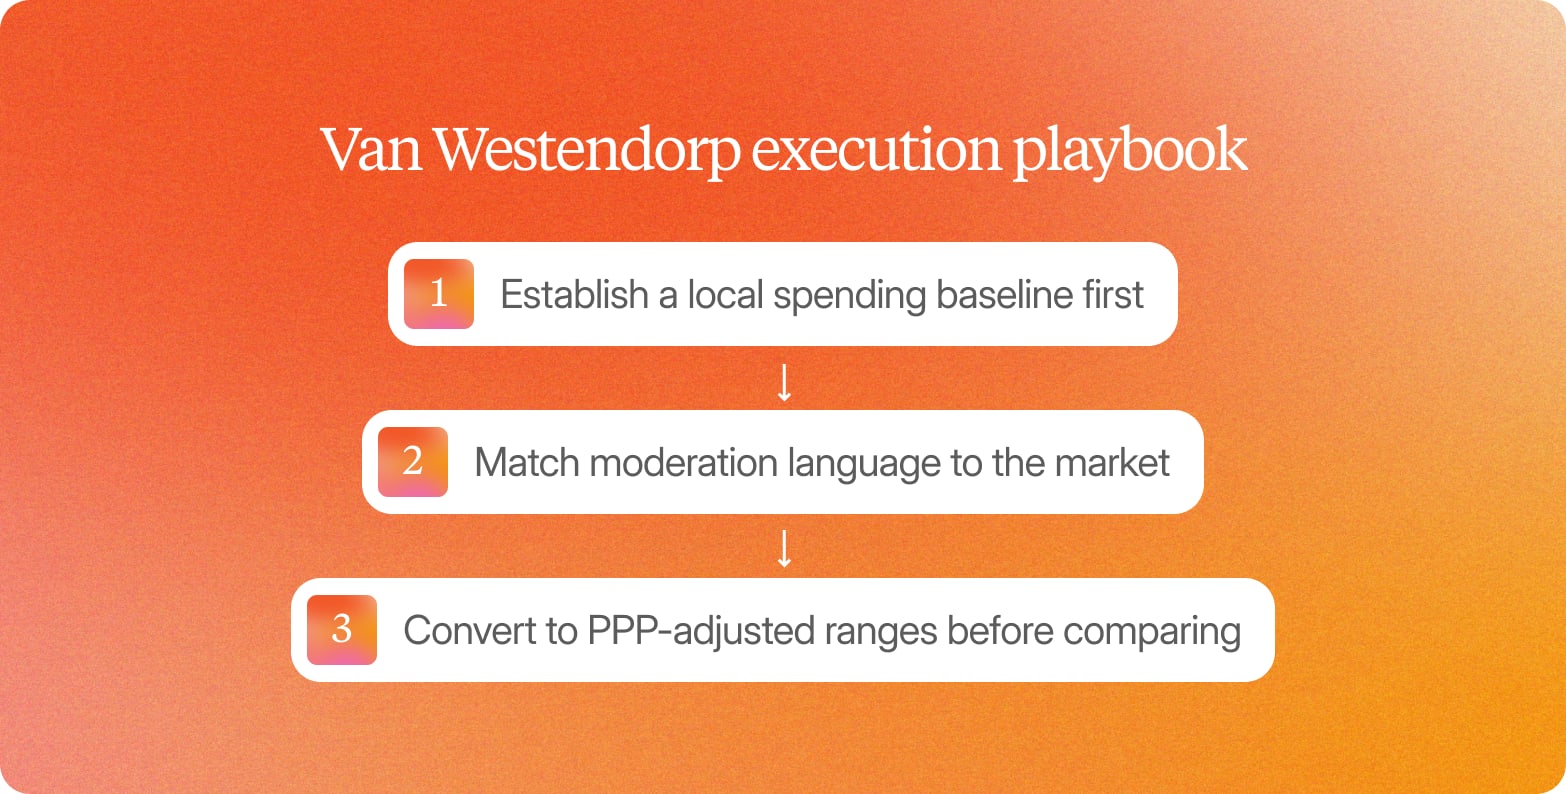
Three execution adjustments
Establish a local spending baseline first. Ask what participants spend on comparable categories in their market. Those who name unusually low prices often turn out to be pricing a different format.
Match moderation language to the market. Culturally loaded phrasing around price and value does not translate. AI-moderated interviews across 50+ languages, with adaptive probing that follows what participants say, reduce the moderator-driven framing market researchers watch for in multi-market fieldwork.
Convert to PPP-adjusted ranges before comparing. Nominal comparisons across markets with different income levels mislead. Purchasing power parity adjustment creates a common frame, making customer price perceptions in Mexico and the Netherlands comparable.
Governance requirements
Document assumptions before fieldwork. Every Van Westendorp pricing study needs the product definition, the reference set, and the segment boundaries on record. These determine what the thresholds mean, and the audit needs them to be retrievable.
Treat inconsistent price ladders as data quality flags. A "too cheap" threshold above a "cheap" threshold signals a comprehension issue, a framing problem, or a genuine outlier. Investigate, apply a defined exclusion rule, or document the flag.
| The range tells you | The range does not tell you |
|---|---|
| Where price resistance begins | What volume you will sell at a given price |
| Where quality doubt sets in | How competitive dynamics will shift |
| How wide the tolerated band is per market | Whether the optimal price point is operationally viable locally |
State those boundaries in every deliverable. Successful pricing strategies also pull in cost structure, competitive positioning, and sales goals; the range says which conversation comes first.
How Conveo makes a Van Westendorp range defensible
Van Westendorp produces a clean range, but it cannot guarantee that participants were pricing the product the team intended to sell, and every downstream pricing analysis inherits that uncertainty. Conveo closes that gap by establishing baseline behavior and spending patterns before any price question, so the four questions land against a verified competitive reference frame.
Conveo is built by researchers, and every insight traces back to a real participant, a timestamped video clip, and a verbatim quote. Stakeholders can open the clips and see for themselves why the acceptable range shifts across segments. Every study feeds the searchable insight library, so the next wave starts with the competitive anchors and consumer perceptions already documented.
For whoever owns the pricing call, that turns the range into a defensible input with its evidence attached, and it stays available when the price comes back up for review.
Enterprise insights teams at Google, Unilever, AB InBev, Kellanova, General Mills, and JDE Peet's rely on Conveo to understand their consumers.
Frequently Asked Questions
What are the four van Westendorp questions?
The four van Westendorp survey questions, in fielding order, are: "At what price would this product be so cheap that you would question its quality?" "At what price would this product be a bargain?" "At what price would this product be getting expensive, but you would still consider buying it?" And: "At what price would this product be so expensive that you would not consider buying it?" Together, they map an acceptable price range across the price spectrum, including the point at which a low price undermines perceived product quality. They do not capture why buyers accept or reject a price.
What is the difference between van Westendorp and Gabor-Granger?
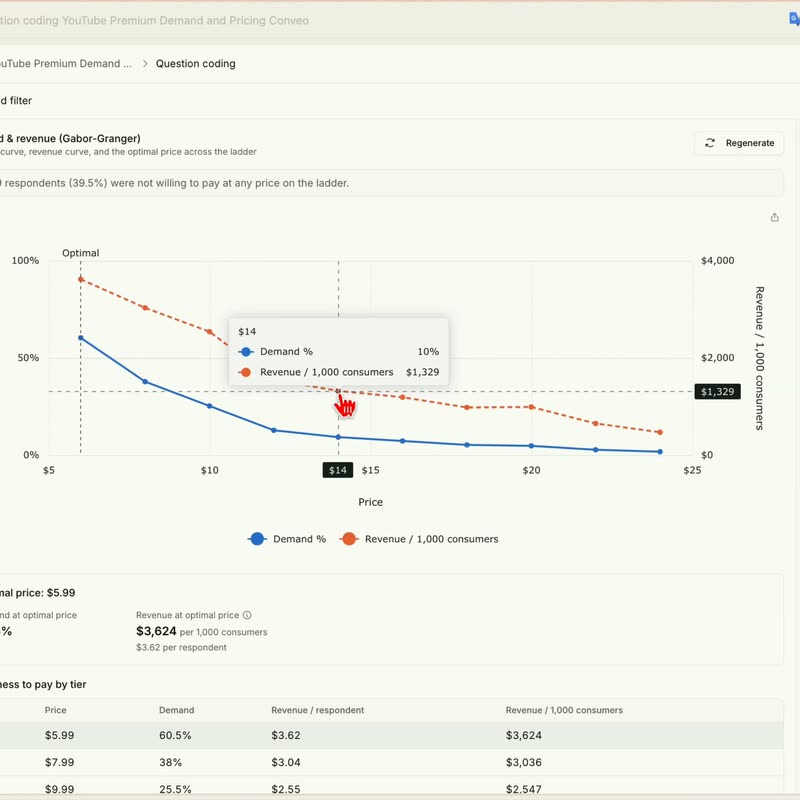
Van Westendorp and Gabor-Granger answer different pricing questions. Gabor-Granger is monadic: participants see one price point and state their purchase intent, then repeat at different price points, building a demand curve that identifies the revenue-maximizing price and measures purchase likelihood at each level. Van Westendorp maps an acceptable range using four threshold questions and collects no purchase-intent ratings. Use Gabor-Granger for revenue optimization, Van Westendorp for feasibility.
How do you calculate the Optimal Price Point in van Westendorp?
The Optimal Price Point (OPP) is where the "too cheap" and "too expensive" curves intersect on a plotted Van Westendorp graph. At that point, the same percentage considers the price too high as too low, the statistical balance point across the sample. The OPP is often reported as the ideal price, but it only shows where resistance is lowest. Whether buyers will commit at that price is a separate question.
What is the acceptable price range in van Westendorp?
The acceptable price range is bounded by the Point of Marginal Cheapness (PMC) and the Point of Marginal Expensiveness (PME). The PMC sets the lower limit, where "too cheap" crosses "not cheap" and enough participants question quality to erode credibility. The PME sets the upper limit, where "too expensive" crosses over "not expensive" and a high price becomes prohibitively high. It does not show why participants hesitate at the top of that range.
Can you use van Westendorp for SaaS pricing?
Van Westendorp for SaaS pricing establishes an acceptable range across tiers, but on its own it will not tell you which features justify tier differentiation. Establish what participants pay for comparable platforms and which features they use before the Van Westendorp price sensitivity questions begin. That tethers the range to verified spending patterns and to the price expectations potential customers hold. Probe specific capabilities to find the gap that moves a buyer up a tier.
How do you handle outliers in van Westendorp data?
Outliers fall into two categories. Logical inconsistencies are responses where the price ladder is internally invalid, for example, a "too cheap" threshold above the acceptably cheap threshold. Distributional outliers sit far outside the sample, whether implausibly low prices or implausibly high ones. Flag inconsistent ladders before analysis, and do not filter them silently; review them for fraud or speeding through the survey questions, and document each decision. Removing outliers produces a cleaner pricing analysis but can exclude real resistance from segments that define good value differently.

About the author
Meg Gerli
Research Impact Lead
Meg is a Research Impact Lead at Conveo, working with insights and research teams on the studies they run with Conveo.
Meet Meg on film →Qualitative insights at the speed of your business.
Conveo runs AI-moderated video interviews and structures everything they say.