In this article
TL;DR
The real barrier to data-driven decision-making is decision lag: the insight arrives after the decision has already been made, regardless of how much data a team has on hand.
Qualitative research surfaces the drivers first; quantitative measurement validates how broadly they apply. Running them in reverse order means measuring the wrong things at scale.
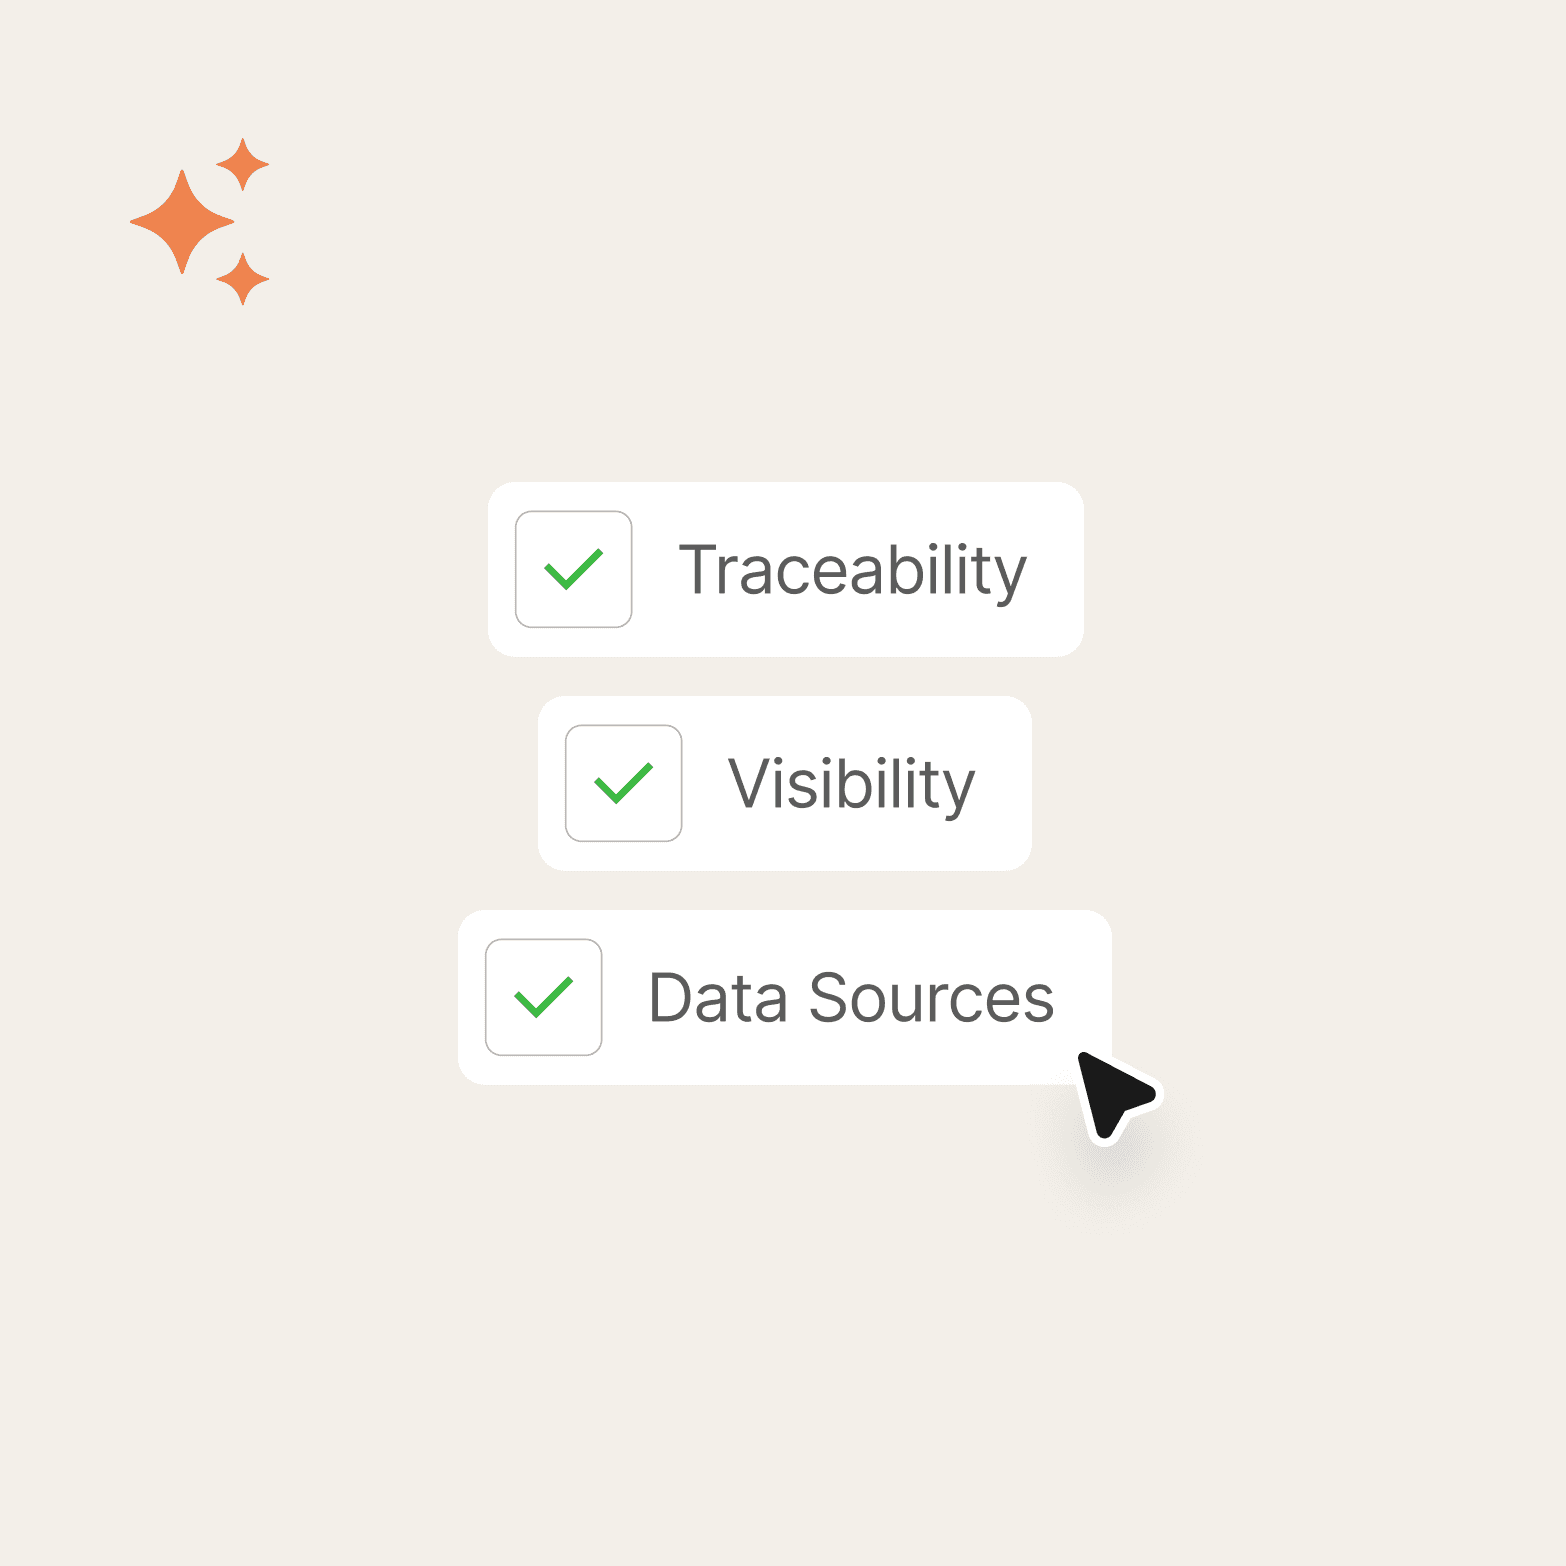
Decision-ready evidence requires traceability to real participants, visible methodology, and triangulation with other data sources.
Continuous customer understanding, run as an ongoing infrastructure rather than periodic research projects, is the operating model that ensures evidence arrives before the decision window closes.
A compounding insight library prevents teams from re-studying questions they have already answered, and turns raw evidence into actionable insights through a deliberate decision-making process rather than more dashboards.
What is data-driven decision making in business?
A product direction gets locked in at a Thursday all-hands. A campaign brief lands on Monday with a media buy closing Friday. By the time a 6- to 12-week agency study delivers its findings, the decision it was meant to inform has already been made on instinct, precedent, or whoever argued loudest in the room. This is a structural problem, and it is costing teams more than they realize.
Data-driven decision-making in business is the practice of grounding business choices in verifiable customer evidence rather than intuition or internal opinion. The distinction sounds obvious until you look at how most organizations actually operate: data collection is constant, dashboards are full, and leadership still cannot explain why the number moved.
Most teams track what happened. Churn increased. NPS dropped three points, one of the key performance indicators every leadership team reviews. Those metrics are real, but they do not tell you what caused the shift or what to do about it. That is the diagnostic gap at the center of data-driven decision-making for business: the difference between knowing that something changed and making informed decisions about why it changed. Surveys can confirm the pattern. They cannot explain the hesitation behind it.
The resolution is a sequencing question, not a data volume question. Qualitative research surfaces the drivers first: the real reasons customers churned, the specific friction that killed adoption, the unarticulated concern that made a prospect choose a competitor. Quantitative measurement: the data analytics layer that validates scope and then confirms how broadly those drivers apply across the population. Run them in the wrong order, and even a big data sample will only tell you the size of the wrong answer.
Traditional qualitative research runs on agency cycles of 6 to 12 weeks. By the time findings arrive, the product roadmap is already locked, and the decision has been made on instinct anyway. The gap exists because the data infrastructure was never built to keep pace with the decisions it is meant to support, even where the intent to be evidence-based is genuine.
Why data-driven decision-making matters (and why most teams still guess)
The most important strategic decisions a leadership team makes rarely wait for the research to come back.
Dashboards and surveys are fast, but they tell you what changed, not why. When engagement dips and no one can explain the mechanism, teams attempting to make a data-driven business decision infer causality from metrics never designed to support it, and the actual customer behavior driving the shift remains unexamined.
The credibility problem compounds this. When stakeholders cannot trace a finding back to a real person who said it, on video, in their own words, research becomes one more opinion in the room rather than the tiebreaker, and business leaders end up defending a decision they cannot fully explain.
The timeline mismatch is structural. A 6- to 12-week research cycle does not fit a two-week product sprint or a campaign brief due Monday, so teams skip the qualitative work and accept the gap.
There's also a cost no one tracks: past research dying in a shared drive. When findings expire in a deck rather than a searchable library, teams revisit questions they've already answered, and past data that could have answered them goes unused.
Teams that treat customer understanding as infrastructure rather than a project break this pattern: decisions are made faster and defended more confidently because the data insights are already in place before the question surfaces.
The diagnostic gap: What dashboards cannot tell you
Quantitative data shows correlation. It cannot prove causation. Your dashboard tells you that NPS dropped three points in Q2, but not whether customers are reacting to a price increase, a support experience that fell short, or an onboarding flow that never landed. Each diagnosis points to a different team and a different fix, and no amount of additional data analysis applied after the fact will supply the answer.
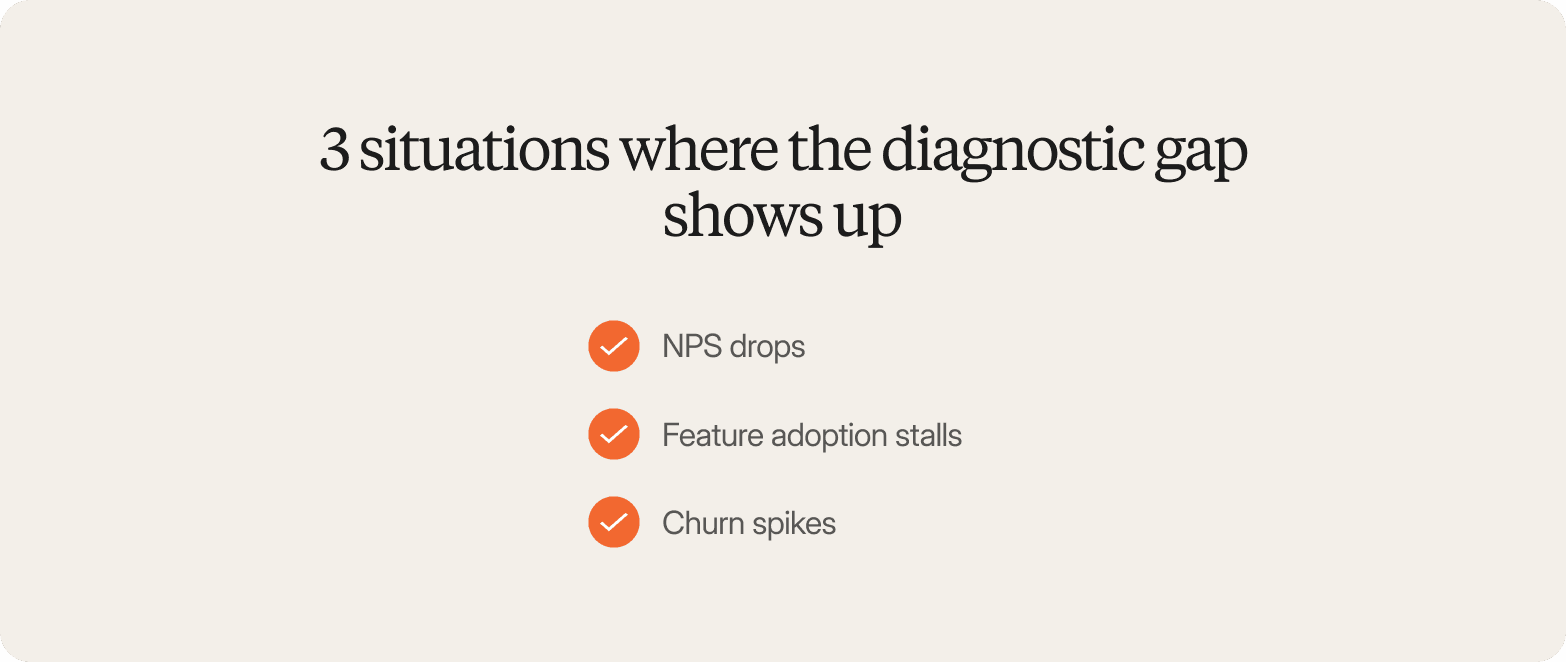
The diagnostic gap shows up in three situations most insights teams recognize immediately:
NPS drops, but the verbatim open-ends ("disappointed overall") don't say whether to brief product, support, or pricing.
Feature adoption stalls, and the cause, whether a UX problem, a value problem, or a discovery problem, reflects a different customer behavior each time.
Churn spikes in one segment, but exit survey responses ("found a better option") aren't specific enough to act on.
Surveys fail to close these gaps because fixed questions cannot follow hesitation. A text box cannot capture the shift in tone when someone mentions a competitor, or the discomfort when they describe a confusing workflow. Those signals require a method that responds to its observations, rather than a fixed script designed solely to collect relevant data at scale.
The approach that closes the gap runs qual first, then quant. Video interviews surface the real drivers, and once those themes are grounded in what participants actually said, quantitative research measures how broadly each driver applies, turning qualitative data into a quantified, actionable insight: not just "pricing is mentioned often" but "38% of churned enterprise customers described the pricing model as misaligned with how they measure value."
Traceability makes this auditable. Every theme must be supported by timestamped video clips and verbatim quotes, so the CMO or CFO can draw conclusions with confidence rather than take them on faith. That's what separates a finding stakeholders act on from one they debate.
How to build a data-driven decision-making framework that actually works: 4 Steps
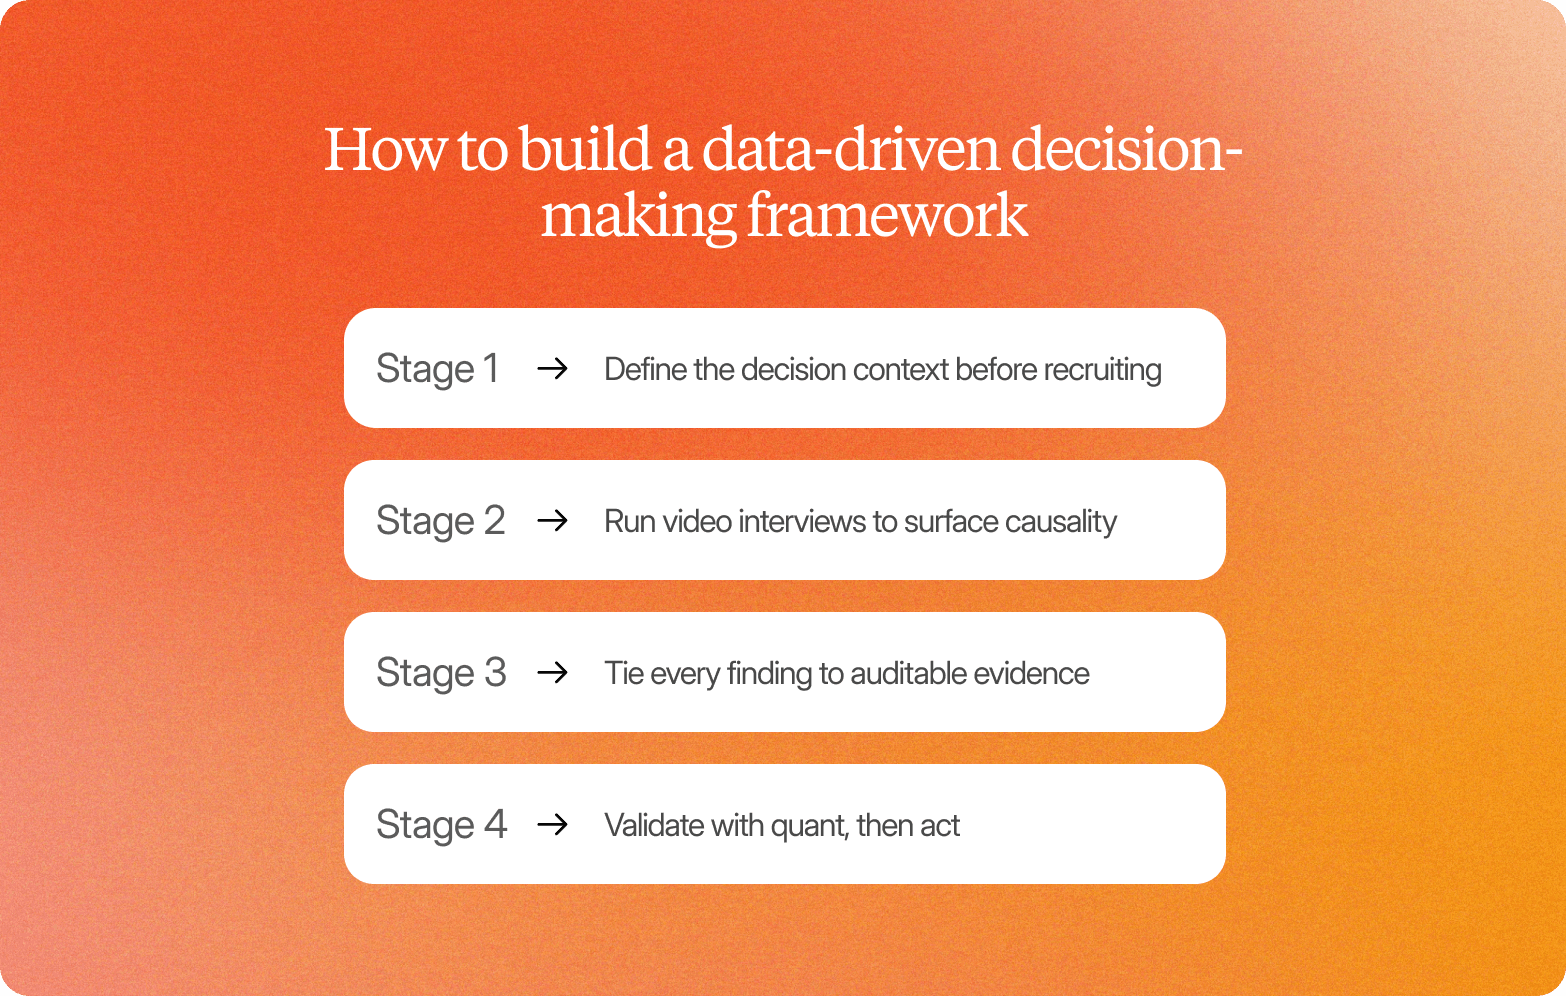
The framework rests on one core principle: qualitative research surfaces the drivers, quantitative measurement validates their scope. Running those two phases in the wrong order, or skipping the first entirely, is how teams end up measuring the wrong things at scale rather than following a decision-making process designed to inform business decisions.
Step 1: Define the decision context before recruiting
Name the choice precisely, identify the stakeholders who need to sign off, and set the timeline before a single participant is screened. Recruitment criteria should map to behavioral segments, not demographic buckets: "female, 25 to 44, household income over $75K" doesn't tell you whether someone actually switched brands recently. Behavioral specificity in the screener is what makes the sample relevant to the business objectives driving the decision.
Step 2: Run video interviews to surface causality
Scripted, fixed-question interviews miss the real blockers because they do not follow hesitation. When a participant pauses before answering a pricing question, or describes a workaround around a product limitation, that's where the finding lives. Async AI-moderated interviews make this realistic at scale: running 10 to 1,000 conversations simultaneously, with adaptive probing built on machine learning that follows a thread of hesitation as a skilled human interviewer would, removing the scheduling bottleneck that typically stretches this phase over weeks.
Sample sizes are small by survey standards, but sufficient for thematic saturation:
Consumer segments: 5 to 15 participants per behavioral segment
B2B roles: 8 to 12 participants per role type
The output is a coded set of themes anchored to timestamped video clips and verbatim quotes, turning unstructured data into something stakeholders can navigate rather than a transcript dump.
Step 3: Tie every finding to auditable evidence
Replace the 40-slide deck with a one-page format that names the finding, the implication, the owner, and the timeline. Every theme links directly to the clip-based readout, so a skeptical stakeholder can verify a claim with a single click. The researcher uses data analysis software rather than a spreadsheet built from scratch, transforming raw data into a defensible recommendation.
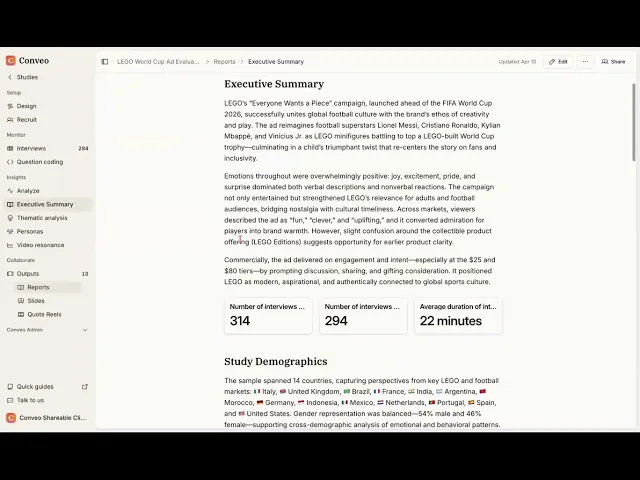
Watch the walkthrough: Reading a Conveo Report
Step 4: Validate with quant, then act
Surveys, A/B tests, or usage data measure how broadly the qualitative drivers apply, applying data analytics and, where the sample supports it, predictive analytics. Quant without prior qual is measuring the distribution of something you haven't diagnosed yet. Execution outcomes should feed back into the insight library so future studies build on prior evidence.
The governance layer
Decision-grade evidence requires traceability to real, named participants; auditability of how themes were constructed; and a searchable repository that keeps customer data accessible to the people who need it. The goal is a research function whose outputs compound rather than reset with every new brief.
The speed problem: Why traditional research arrives too late
The mismatch is structural. A standard agency study runs 6 to 12 weeks:
Scoping and screener design
Recruiting and data collection in the field
Two to four weeks for transcription and analysis
A week or two building the stakeholder deck
By the time findings land, the roadmap is locked, and the campaign brief has gone to creative.
The consequence is a category error: research conducted after the decision is made becomes post hoc validation, confirming what the team already chose rather than shaping it.
The compression mechanism is parallel, asynchronous video interviews. Instead of scheduling 20 sessions over two weeks, all 20 can run simultaneously, with transcription and thematic analysis occurring as each session closes, providing real-time analytics rather than the batch-and-report model most agencies use. Timelines compress from weeks to days without losing the depth that makes qual findings credible.
Teams using this approach analyze while fielding and deliver a clip-based readout leaders can review in under 20 minutes. The rigor stays intact because the method stays intact: real participants, real conversations, real video. What changes is the operational sequence, an efficiency gain that keeps research relevant to the decision window instead of arriving after it closes.
What makes qualitative evidence decision-ready
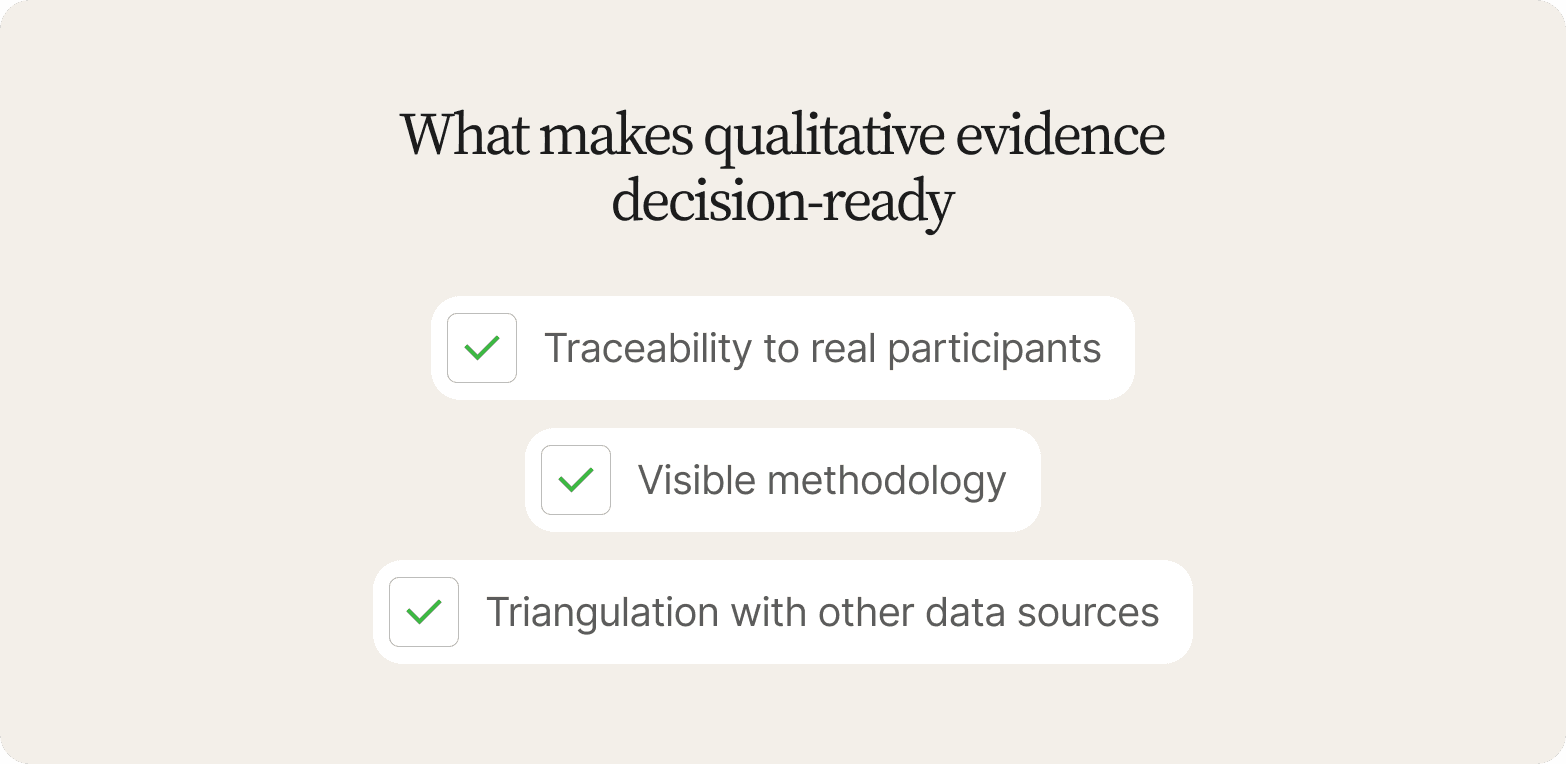
Decision-ready evidence is findings that stakeholders can audit, verify, and act on without requiring the researcher to defend every claim in a meeting. When a VP or General Manager cannot inspect the underlying evidence, findings get accepted on faith or quietly set aside, and neither outcome builds the data-driven culture leadership says it wants.
Three credibility mechanisms close that gap.
Traceability to real participants
Every theme should link directly to timestamped video clips and verbatim quotes, so any leader in the room can see the hesitation, the shift in tone, or the workaround that informed the finding. That's a different bet than trusting an AI-synthesized summary.
Visible methodology
The discussion guide, probing logic, and recruitment criteria should be documented rather than locked in the moderator's memory. Documented methodology, reviewed with the same critical thinking applied to a financial audit, is what separates a finding that survives scrutiny from one that collapses under a single pointed question.
Triangulation with other data sources
Video findings gain additional weight when cross-referenced with CRM notes, sales-call objections, and support ticket language, drawing on internal and external sources rather than a single input, and requiring genuine data integration across systems rather than a one-off export. A theme that surfaces in interviews and also appears in support tickets is a finding that earns budget. A theme in only one source is a hypothesis.
Video interviews capture signals that text responses and surveys flatten entirely. A pause before answering a pricing question reveals uncertainty that a written survey response would record as a neutral "somewhat agree." A shift in tone when a competitor is mentioned shows frustration that a closed-ended scale would average out. Visible reactions during a product demonstration show what customers actually prioritize versus what they claim to value when writing into a form, a signal that plain data processing of a survey export can never recover.
On the governance side: enterprise decisions get blocked when research methods cannot pass legal review. SOC 2 Type II certified, GDPR compliant, EU hosting (Belgium): these are baseline data security requirements for European teams, not optional additions. They remove the procurement friction that otherwise delays deployment by months, or kills it entirely.
How to operationalize continuous customer understanding
Research that only runs when something goes wrong operates like a fire alarm rather than a research function: teams are blind between studies, making calls on assumption and instinct until the next crisis forces a commission. The alternative is a different operating model, a genuinely data-driven approach, one where customer understanding runs continuously alongside the work it is meant to inform.
Four components make that operational.
Cadence and intake
Set a regular research rhythm before a question appears: monthly deep dives on priority topics, quarterly category reviews, and a standing track for ad hoc decision support. Pair that with a lightweight intake process so stakeholders in product, marketing, and brand can request evidence without triggering a full agency RFP. When the path to a research answer is shorter than the path to a decision, teams start using evidence habitually rather than occasionally, and data initiatives stop competing for the same few weeks of agency time.
Ownership and accountability
Assign a research lead or insights function to own the workflow and maintain quality standards. Then distribute execution. Product managers run usability rounds. CX teams run satisfaction pulses. Marketing runs concept tests before campaigns close. When customer understanding is owned centrally but executed broadly, it stops being a bottleneck and becomes a shared capability, one that depends on data skills and basic data literacy spreading across teams rather than sitting with a single specialist. The insights function shifts from doing all the work to setting the standard and synthesizing the results.
Reuse and compounding
This is where continuous customer understanding pays back at organizational scale. A searchable insight library means that when a new question arises, the first step is to check what is already known before commissioning a fresh study. Prior evidence surfaces. Contradictions flag. Gaps become visible. Studies build on each other rather than starting from zero, and historical data from a study run 18 months ago can still answer a question today. In practice, teams report that a well-maintained library reduces repeat research and sharpens the questions they bring to new studies, because they already know what the last round answered.
Activation and measurement
Findings that do not connect to decisions are decorative. Close the loop by tracking which insights informed which calls, and feed execution outcomes back into the library. When a concept test predicted strong performance and the product launched successfully, that connection should be recorded. Future studies become smarter because the library holds not just what consumers said but also what happened when teams acted on it, and because the record keeps external data on market response alongside the internal record of the decision.
The multi-country dimension compounds the benefit. When interviews run across 50+ languages without separate moderation and localization cycles, research delays shrink, and global teams stop waiting on regional sequencing. A question that used to require three separate agency engagements across markets can run as a single study.
For teams that need an ongoing read of their market rather than a one-off answer, Conveo StoryLines runs continuous programs in chapters and waves, with themes tracked across waves and findings connecting across studies.
The result is a knowledge base that grows more valuable with every cycle, rather than a shared drive full of decks no one opens after the debrief, and a foundation for spotting the future trends a market intelligence team is expected to catch before a competitor does.
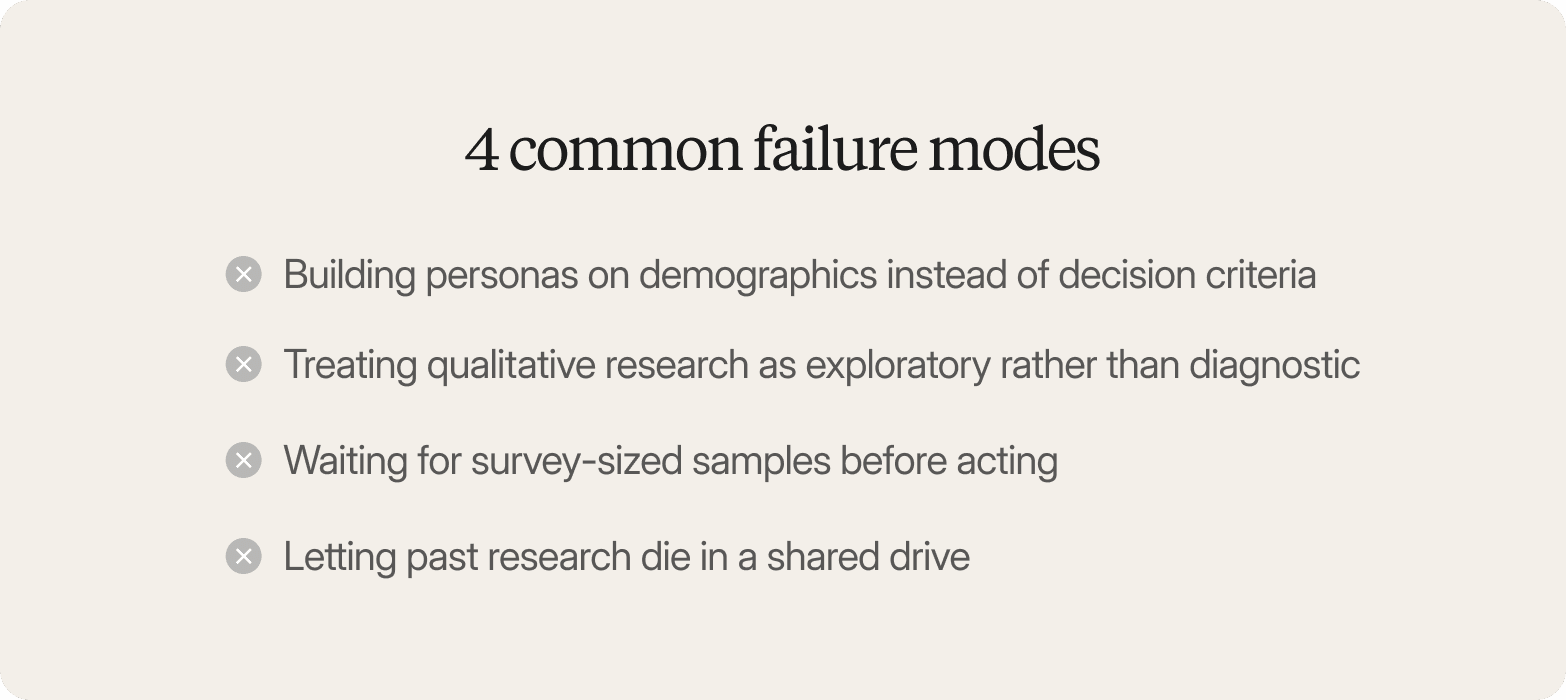
4 common failure modes (and how to avoid them)
The most common failure in data-driven decision-making in business is a diagnostic gap: teams invest in dashboards and analytics platforms that tell them a metric moved, but have no reliable mechanism to explain why. Decisions stall. Leaders hedge. The dashboard gets blamed when the real problem is that no one ever spoke with a customer to explore the data beyond what the metric already showed.
Four specific failure modes drive most of this:
1. Building personas on demographics instead of decision criteria
Personas constructed around age brackets, income bands, or vague psychographic labels like "health-conscious" do not explain why someone chose one product over another, or what objection nearly stopped them. The fix is definitional: before recruiting a single participant, define the behavioral segments you need. Each segment should map to a distinct decision context, a specific trigger, a competing option considered, and a reason for switching or staying. Interviews designed around those criteria turn complex market data into segments you can actually act on.
2. Treating qualitative research as exploratory rather than diagnostic
Framing qual as "soft" or "directional" is how findings get deprioritized before they reach the stakeholder who needs them. Qualitative research is the only method that explains causality. Every finding should trace back to auditable evidence: a verbatim quote, a video timestamp, a participant who said it in their own words, or the raw material used to interpret the data, rather than a conclusion presented without its source. Without that traceability, findings become assertions, and assertions do not survive a budget meeting.
3. Waiting for survey-sized samples before acting
The threshold for thematic saturation in qualitative research is 5 to 15 participants per segment, not 500. In practice, new themes stop emerging well before most teams feel "statistically comfortable." Waiting for a quant-scale sample before briefing a product team or updating a positioning framework means the decision window has already closed. The correct sequence reaches thematic saturation with qual first, then validates directional findings with quant and statistical analysis.
4. Letting past research die in a shared drive
Without a searchable repository that connects findings across studies, teams re-investigate questions they have already answered. Budget gets spent twice. Institutional knowledge disappears when someone leaves. The operational requirement is a repository with consistent tagging and enough data integrity that a finding pulled from three years ago is still trustworthy today, built to outlast the folder structure that made sense to one person in 2023.
There is a fifth failure mode specific to B2B research that compounds all four: failing to map buying-group dynamics explicitly. Procurement, IT, and end users evaluate the same vendor against entirely different success criteria. Procurement cares about contract terms and vendor risk. IT evaluates integration burden and security posture. End users care whether the product fits their actual workflow. Research that interviews only the champion and ignores the technical evaluator or the procurement lead produces a partial picture. In practice, the perspective that gets missed is often the one that kills the deal.
These failure modes share a common root: research infrastructure that was never built to keep pace with the decisions it is supposed to support.
Consumer Understanding Infrastructure: Closing the Decision-Lag Gap
Conveo is built to close exactly this gap: a platform that adds an always-on layer to research, ensuring customer evidence arrives before the decision window closes. That means the understanding is continuous, traceable, and compounding: a capability the organization runs on, day after day, built on data quality that survives a leadership review. A few examples below show what that looks like in practice.
Always-on customer understanding, tied to decision-lag
Conveo's AI-moderated video interviews run asynchronously across 10 to 1,000 conversations simultaneously, in 50+ languages, with adaptive probing that follows what participants actually say rather than a rigid script. Thematic analysis runs as each session closes. For teams that need a continuous read of their market, Conveo StoryLines runs wave-based programs with themes tracked across chapters. Teams report moving from a multi-week agency cycle to a matter of days.
Research rigor and traceability
Conveo is built by researchers, bringing genuine research methodology to a category often built by teams retrofitting a survey tool. Every theme connects to timestamped video clips and verbatim quotes, so stakeholders who were not in the room can audit the evidence directly, which is what moves findings from "the researcher says so" to "here is the person who said it." Participants are 68% more open than with a human moderator, and 94% rate the experience positively.
"You can see genuine research fluency in the product decisions. It's not the only reason we'd choose Conveo, but it's a strong proof point especially compared to competitors who are building without that research foundation"
Research & Insight Lead, Canva
Compounding via a searchable insight library
Every study feeds into a searchable insight library built for data sharing across product, marketing, and research teams, so the next question starts from what is already known rather than from zero.
Compliance and governance
Conveo is SOC 2 Type II certified, GDPR compliant, EU hosting (Belgium).
Trusted at scale
Teams at Google, Bosch, Reddit, and FOX rely on Conveo for continuous, always-on understanding of their customers, without adding headcount or trading away depth, in service of the business goals that sit above any single study.
Frequently Asked Questions
What is data-driven decision making in business?
Data-driven decision making in business is the practice of grounding business choices in verifiable customer evidence rather than intuition or untested assumptions. The distinction is not whether an organization has data, but whether it can use that data effectively to explain behavior. The credible workflow runs qualitative research first, to surface the drivers behind what people do, then quantitative measurement to validate how broadly those drivers apply. Skipping the first step produces numbers without explanation; skipping the second produces explanation without scale.
What are some data-driven decision-making in business examples that combine qualitative and quantitative evidence?
Product example: A team saw low adoption of a new feature, ran video interviews with 12 slow-to-activate users, and found onboarding assumed technical knowledge most users lacked. Redesigning the flow lifted day-7 activation by 40%. Marketing example: A brand team saw declining ad performance in one segment, conducted interviews with 15 people in that cohort, and found that the creative led with speed, even though the segment actually prioritized reliability. Revising the messaging around that finding improved click-through rate by 28%. In both cases, the qualitative evidence identified the right problem and the quantitative data confirmed the fix worked.
What are the benefits of data-driven decision-making?
Faster decision velocity, higher stakeholder confidence, and fewer resources wasted on assumptions. Instead of waiting 6 to 12 weeks for agency research, teams report reaching decision-ready findings in days. Every finding traces back to a real participant, which replaces opinion debates with auditable evidence. The compounding benefit matters as much as the speed: findings living in a searchable repository mean teams stop re-researching questions they've already answered, and resource allocation shifts toward what customers actually prioritize.
How do you implement data-driven decision making in business?
Start before you recruit: define the specific choice being made, the stakeholders who need to sign off, and the deadline that makes the decision real. Run AI-moderated video interviews with adaptive probing that follows what participants actually say rather than a fixed script. Replace the 40-slide deck with a one-page format that links each theme directly to timestamped video clips and verbatim quotes, allowing stakeholders to verify the evidence themselves. Validate scope with quantitative data, then feed execution outcomes back into the insight library so the next study builds on this one.
What does it take to make customer evidence auditable?
Three things: traceability to real participants, so every theme links to timestamped video clips and verbatim quotes; visible methodology, so the discussion guide and recruitment criteria are documented rather than left in the moderator's memory; and a searchable repository that connects findings across studies over time. Meet those three conditions and findings survive scrutiny from skeptical stakeholders and compound rather than expire after the debrief.

About the author
Dieter De Mesmaeker
Co-Founder & CEO
Dieter is CEO and co-founder of Conveo. Before starting the company, he founded DataCamp and scaled it into one of the leading edtech platforms in the world.
More by Dieter →Qualitative insights at the speed of your business.
Conveo runs AI-moderated video interviews and structures everything they say.