

TL;DR
Best for: market researchers and pricing teams who need an acceptable price range that survives a pricing committee.
The Van Westendorp pricing model, also called the Westendorp Price Sensitivity Meter, maps the acceptable price range across four psychological thresholds.
It doesn't tell you why participants drew the line, and that gap is where pricing strategy decisions stall in review.
This guide covers what the four Van Westendorp survey questions measure, how to read the Van Westendorp graph, and when the method fits a broader pricing analysis.
It also shows how to keep direct consumer input attached to each threshold, so the optimal price range holds up past the first "why" in the room.
The pricing review is three slides in when someone asks the question you were hoping to avoid: "Why does the acceptable range start here and not ten dollars lower?" You have the curves and the intersections. The chart alone cannot answer that question, and by the time someone asks, the meeting is the wrong place to answer it.
The Van Westendorp pricing model, also known as the Price Sensitivity Meter, is one of the most widely used frameworks in the market research industry, and one of the most frequently misread. Its four intersections often get reported as definitive outputs. The method was built to produce a map of psychological thresholds, drawn from how people describe consumer price perceptions and price expectations relative to value. Treating a curve crossing as a precise recommendation, with no reasoning attached, is where stakeholder credibility breaks down for market researchers running a Van Westendorp analysis.
This guide covers the key questions the model asks, how to read the chart, when the method fits into broader pricing strategy techniques, and how to present the output so it survives a pricing committee.
What is the Van Westendorp pricing model?
The Van Westendorp pricing model is a survey method for mapping the acceptable price range a target market will accept, without asking respondents to name a single number. Developed by Dutch economist Peter van Westendorp in 1976, it approaches price perception through four survey questions rather than one direct question: at what price would you consider this product so expensive you wouldn't buy it, at what price does it feel expensive but still worth considering, at what price does it feel like a bargain, and at what price would it be so cheap you'd question its quality.
Unlike models that assume lower prices always increase demand, Van Westendorp recognizes that low prices can trigger doubts about product quality and cost sales. That dual-boundary logic is what makes the output useful: it identifies the acceptable price range, also called the optimal price range, bounded by the point of marginal cheapness (lower limit) and the point of marginal expensiveness (upper limit), and covered in detail below.
The method earns its place when a product is new enough, or the competitive landscape unclear enough, that no price anchor exists yet. It does not tell you how purchase-intent ratings shift within that range, or how segments of potential customers weigh price against alternatives. Those gaps matter when choosing between Van Westendorp and methods like Gabor-Granger or conjoint analysis.
The 4 questions and what they measure
These four Van Westendorp pricing questions, sometimes just called the Van Westendorp survey questions, map distinct psychological thresholds in how buyers relate price to value.
1. "At what price would this be so expensive you would not consider buying it?"
The upper rejection threshold: where price becomes a hard stop. People often mistake it for the pricing ceiling. It marks the edge of what participants will entertain, and many buyers reject the product well before it reaches a prohibitively high price.
2. "At what price would it feel expensive, but you would still consider buying it?"
The point of marginal expensiveness is arguably the method's most strategically useful output. It captures the upper end of the price spectrum where purchase stays plausible, if reluctant. Teams often underuse this in favor of the optimal price point.
3. "At what price would this feel like a bargain?"
The point of marginal cheapness: the price participants would call acceptably cheap, above the point where doubt about product quality kicks in. It sits above the floor.
4. "At what price would this be so cheap you would question its quality?"
The lower rejection threshold, and the most often misread. A low number here marks the buyer's quality floor, and pricing below it signals a problem.
The optimal price point sits where the "too cheap" and "too expensive" curves intersect: the price where the fewest participants reject the product on either end. It's one point, and it isn't automatically the right price for a specific segment: the PMC-to-PME range is the actual decision output, and mistaking a single ideal price for that range is the most common analytical error teams make.
How to read the chart
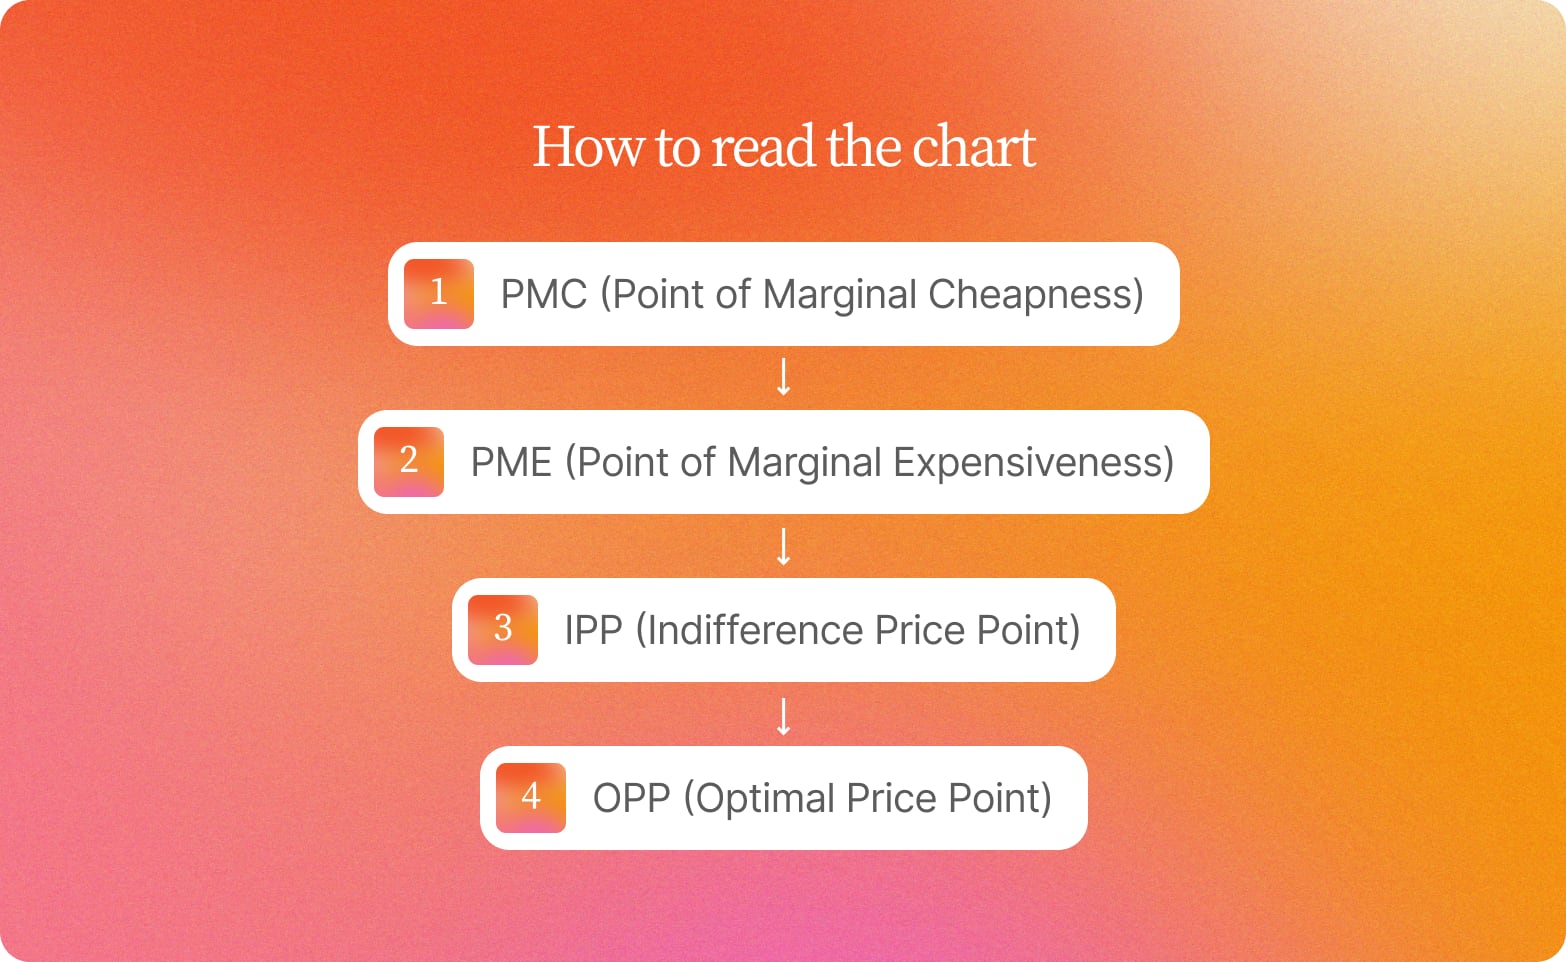
The Van Westendorp graph, sometimes called a price map, plots four curves from the raw survey answers. Two of them, "cheap" and "expensive," get inverted into "not cheap" and "not expensive" so they read against the "too cheap" and "too expensive" curves at the same price points:
PMC (Point of Marginal Cheapness): where "too cheap" crosses the inverted "not cheap" curve. Quality suspicion outpaces value below this point. Sets the floor.
PME (Point of Marginal Expensiveness): where "too expensive" crosses the inverted "not expensive" curve. Resistance outpaces willingness to pay above this point. Sets the ceiling.
IPP (Indifference Price Point): where "cheap" and "expensive" cross, at the same percentage on each curve. Clusters near the perceived category norm.
OPP (Optimal Price Point): where "too cheap" and "too expensive" cross. Equal rejection at both extremes; this line-crossing approach produces the most misread labels.
Read the OPP as a balance point, price inside the range
The OPP marks the point of balanced extreme rejection. The decision-useful output is the range between the PMC and PME; where you land within it is a business call shaped by competitive positioning, cost structures, and margin targets.
Why the chart alone isn't enough
A pricing committee that sees a range of $18–$34 asks which participants pulled the PME down, and why. Survey data alone rarely gives an accurate estimate of who's driving that shift, so the meeting ends with another research round commissioned.
Conveo plots the curves as responses land, and every threshold a participant names links back to their timestamped video clip, so a stakeholder can watch the participants who drew the PME line explain themselves. Segment cuts matter too: curves run by usage frequency or price sensitivity across different survey responses often diverge sharply from the aggregate.
When to use Van Westendorp, and when not to
Teams new to Van Westendorp price sensitivity work often assume the model applies everywhere. In practice, the Van Westendorp method is one tool in a sequence, and choosing the right one is as much a sequencing problem as a methodology problem.
Van Westendorp | Gabor-Granger | Conjoint analysis | Live pricing test | |
|---|---|---|---|---|
Decision risk | Low–medium: exploratory | Medium: revenue optimization | High: launch/repositioning | High: needs real transactions |
Competitive context | Works without benchmarks | Needs a defined price ladder | Models cross-brand trade-offs | Assumes a live market |
Buyer fit | Consumer, early-stage SaaS | Consumer/SMB needing a demand curve | Enterprise, multi-attribute decisions | High-traffic e-commerce/SaaS |
Output | Acceptable range, floor/ceiling | Revenue-maximizing price | Willingness to pay by bundle | Actual conversion at each price |
Misses | Competitive trade-offs | Anchoring risk from a poor ladder | Overkill pre-concept | Needs real customers, pre-launch |
Sequencing the methods
Teams often sequence these: Van Westendorp to establish the range, then Gabor-Granger to find the revenue-optimizing point within it. Conjoint earns its cost once product features are defined and trade-offs matter; live tests belong after the research.
Van Westendorp fits best when three conditions hold:
The product is new rather than an established product with a known price history
The competitive field is too fragmented to benchmark cleanly
The team needs a defensible range tied to real sales goals before committing to a number
Outside those conditions, a different method fits better.
Running it at enterprise scale
Most guidance stops at methodology and skips how to run a Van Westendorp pricing study across six markets without producing six charts stakeholders can't act on.
1. Size the sample for each segment
Plan for at least 100 completed responses per segment you intend to analyze separately (most practitioners target 150–300); below that, intersections become unstable and hard to defend
A six-market study with two segments per market means scoping 1,200+ completes before fieldwork starts
A well-screened 250-person sample of actual category purchasers, screened for purchase authority and category involvement, gives a more accurate estimate of true price sensitivity than 800 general-population responses, and avoids noise that distorts consumer perceptions of price
2. Handle outliers and currency across markets
Open-ended price inputs generate outliers in every study; trim values under roughly 5% of the sample (especially high-end extremes pulling the "too expensive" threshold up), document the cutoff, and flag trimmed responses rather than silently removing them; investigate if a market's outlier rate exceeds 10%
Pin exchange rates to a fixed date, report cross-market results in one reference currency for executives (local-currency charts for market-level decisions), and apply a purchasing-power-parity adjustment where income levels diverge substantially, since raw conversion alone conflates real price sensitivity with exchange-rate arithmetic
3. Frame the range as a decision boundary
Stakeholders who expect one number can lose confidence when they see overlapping bands across markets, so frame it as a decision boundary: "these are the prices at which demand holds across all six markets," grounded in the customer price perceptions each market actually reports.
Conveo fields the same four questions simultaneously across markets in local currency, and the AI research assistant probes divergent responses in the same session, so a participant in a specific target market marking a price "too expensive" can clarify whether that's the number itself, a currency-conversion instinct, or a specific local competitor.
Pairing Van Westendorp with qualitative follow-ups
Van Westendorp shows where participants drew the line. It doesn't show why, and that's where recommendations stall: finance wants to know what drives the "too expensive" ceiling before approving a launch price, and a curve on a slide doesn't answer that.
The Newton Miller Smith extension
One well-known extension addresses part of this gap quantitatively: it adds a purchase intent rating at the "cheap" and "expensive" prices, asking how likely a respondent would buy on a typical 5-point scale. That layer turns raw Van Westendorp results into something closer to a demand curve, but it doesn't capture why a respondent chose a given rating, which is the gap AI-moderated interviews close.
Closing the reasoning gap with AI-moderated interviews
Embedding the four threshold questions inside AI-moderated video interviews closes that gap. When a participant names a "too high" price, Conveo's adaptive probe fires immediately: what drove that number, a competitor's price, a budget constraint, a quality signal? The probe lands while the reasoning is still active, capturing direct consumer input in the moment.
"The only time you could do in-the-moment moderation was if I was doing it myself, in someone's home, in a focus group. Coming back two hours later on a community platform, some people have forgotten their point."
— Dafydd Jones, Associate Director, Ninth Seat
What comes back is verbatim language linked to specific curve points. Participants who name a low "too cheap" floor tend to reference category norms; those compressing the ceiling cite specific competitors. Neither is visible in the curve alone. That changes the recommendation: instead of a range and a wait for "why," researchers walk in with quotes anchored to each threshold, an argument finance can stress-test rather than take on faith.
3 common failure modes
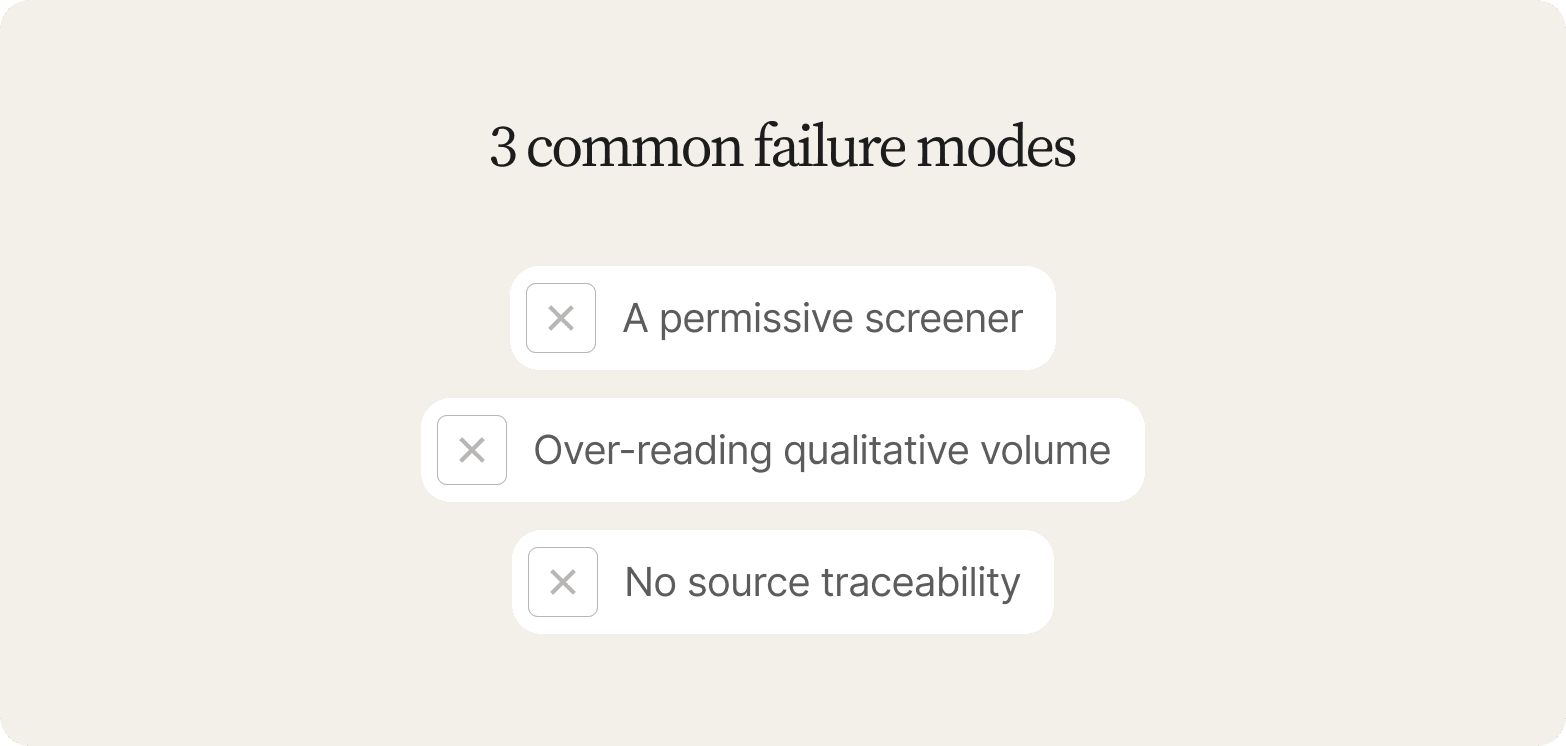
1. A permissive screener
Participants who don't match the target market complete interviews anyway, standing in for potential customers who wouldn't buy. The findings look rich, but the sample is wrong, invisible until decisions get built on it.
2. Over-reading qualitative volume
Running 200 interviews in parallel can create a false sense of statistical confidence. Qualitative findings show the range of perspectives without measuring prevalence, so presenting a theme from 40 interviews as though it represents 40% of the market is a category error that market researchers trained on quantitative sampling will catch immediately.
3. No source traceability
Findings most often get challenged when no one can trace them to a real person who said them. The fix: treat screener design as a research decision tied to the Van Westendorp methodology itself, label findings as directional rather than representative, and build every deliverable so claims link back to the source conversation.
Stakeholder-ready reporting
A pricing report earns the room with five components, in order:
Acceptable price range with confidence framing: the PMC-to-PME range and indifference zone, presented with sample size and segment noted, never a single number.
Recommended test prices: two or three price points (conservative, optimum, stretch), each labeled with the trade-off it represents.
Segment cuts: broken out by tenure, usage frequency, geography, or the strategic objectives behind the purchase, since an aggregate range hides very different thresholds between heavy and light users.
Volume and revenue sensitivity: projected demand and revenue at each recommended price, the section that most often moves a pricing analysis from "interesting finding" to "approved direction."
Qualitative evidence and pre-mortem: verbatim reasoning behind the thresholds, closed with two or three named failure modes, e.g., "if the relaunch reads as a line extension rather than a new product, the stretch price triggers the too-expensive threshold," more useful than a confidence interval.
The sweet spot for most teams sits closer to the PME than the PMC, since undershooting trades margin for volume without a matching demand gain. Successful pricing strategies pair that range with the reasoning behind it.
Where Conveo fits in a Van Westendorp study
Every gap this guide has covered (the OPP mistaken for a recommendation, an aggregate range hiding segment disagreement, a stakeholder who can't get past "why") traces back to one cause: a curve with no reasoning attached.
Conveo runs the four Van Westendorp questions inside AI-moderated video interviews, so every threshold carries its explanation in the same session. A behavioral screener confirms category purchase and decision-making role beforehand, and every curve point traces back to direct consumer input from a real participant speaking on video. As studies accumulate across markets, that logic becomes a living reference point for the next pricing decision.
Built for procurement and data-residency requirements

Conveo is SOC 2 and GDPR compliant and headquartered in Belgium, with personal and company data hosted in Europe.
Frequently asked questions
What is the Van Westendorp pricing model?
What is the optimal price point in Van Westendorp?
What are the limitations of the Van Westendorp pricing model?
When should you use Van Westendorp versus conjoint analysis?
Can Van Westendorp be used for B2B pricing research?
What is the difference between Van Westendorp and Gabor-Granger?