In this article
TL;DR
Conjoint analysis software falls into two main types: survey platforms for standard studies and specialist tools for more complex designs and detailed participant-level scores.
Both types assume you already know which attributes to test and how to describe them. Qualitative interviews can help you choose and validate attributes before fielding the study.
Compare tools on the conjoint methods they support, how they calculate scores, their security certifications, and their integrations.
This guide helps Insights and CMI leads choose the right software for their research needs and make sure the results support sound product and pricing decisions.
Choosing conjoint analysis software is rarely straightforward because vendors package very different capabilities under the same label. A platform that looks easy to use may not support the study you need to run. If you only find that out after data collection has begun, it can mean restarting the project or paying for even more tools.
This guide explains how survey platforms and specialist conjoint tools differ, and which questions to ask vendors before you sign. You’ll know what your study needs before the first demo, so you can pick software that suits it from the start.
What conjoint analysis software measures (and what it doesn't)
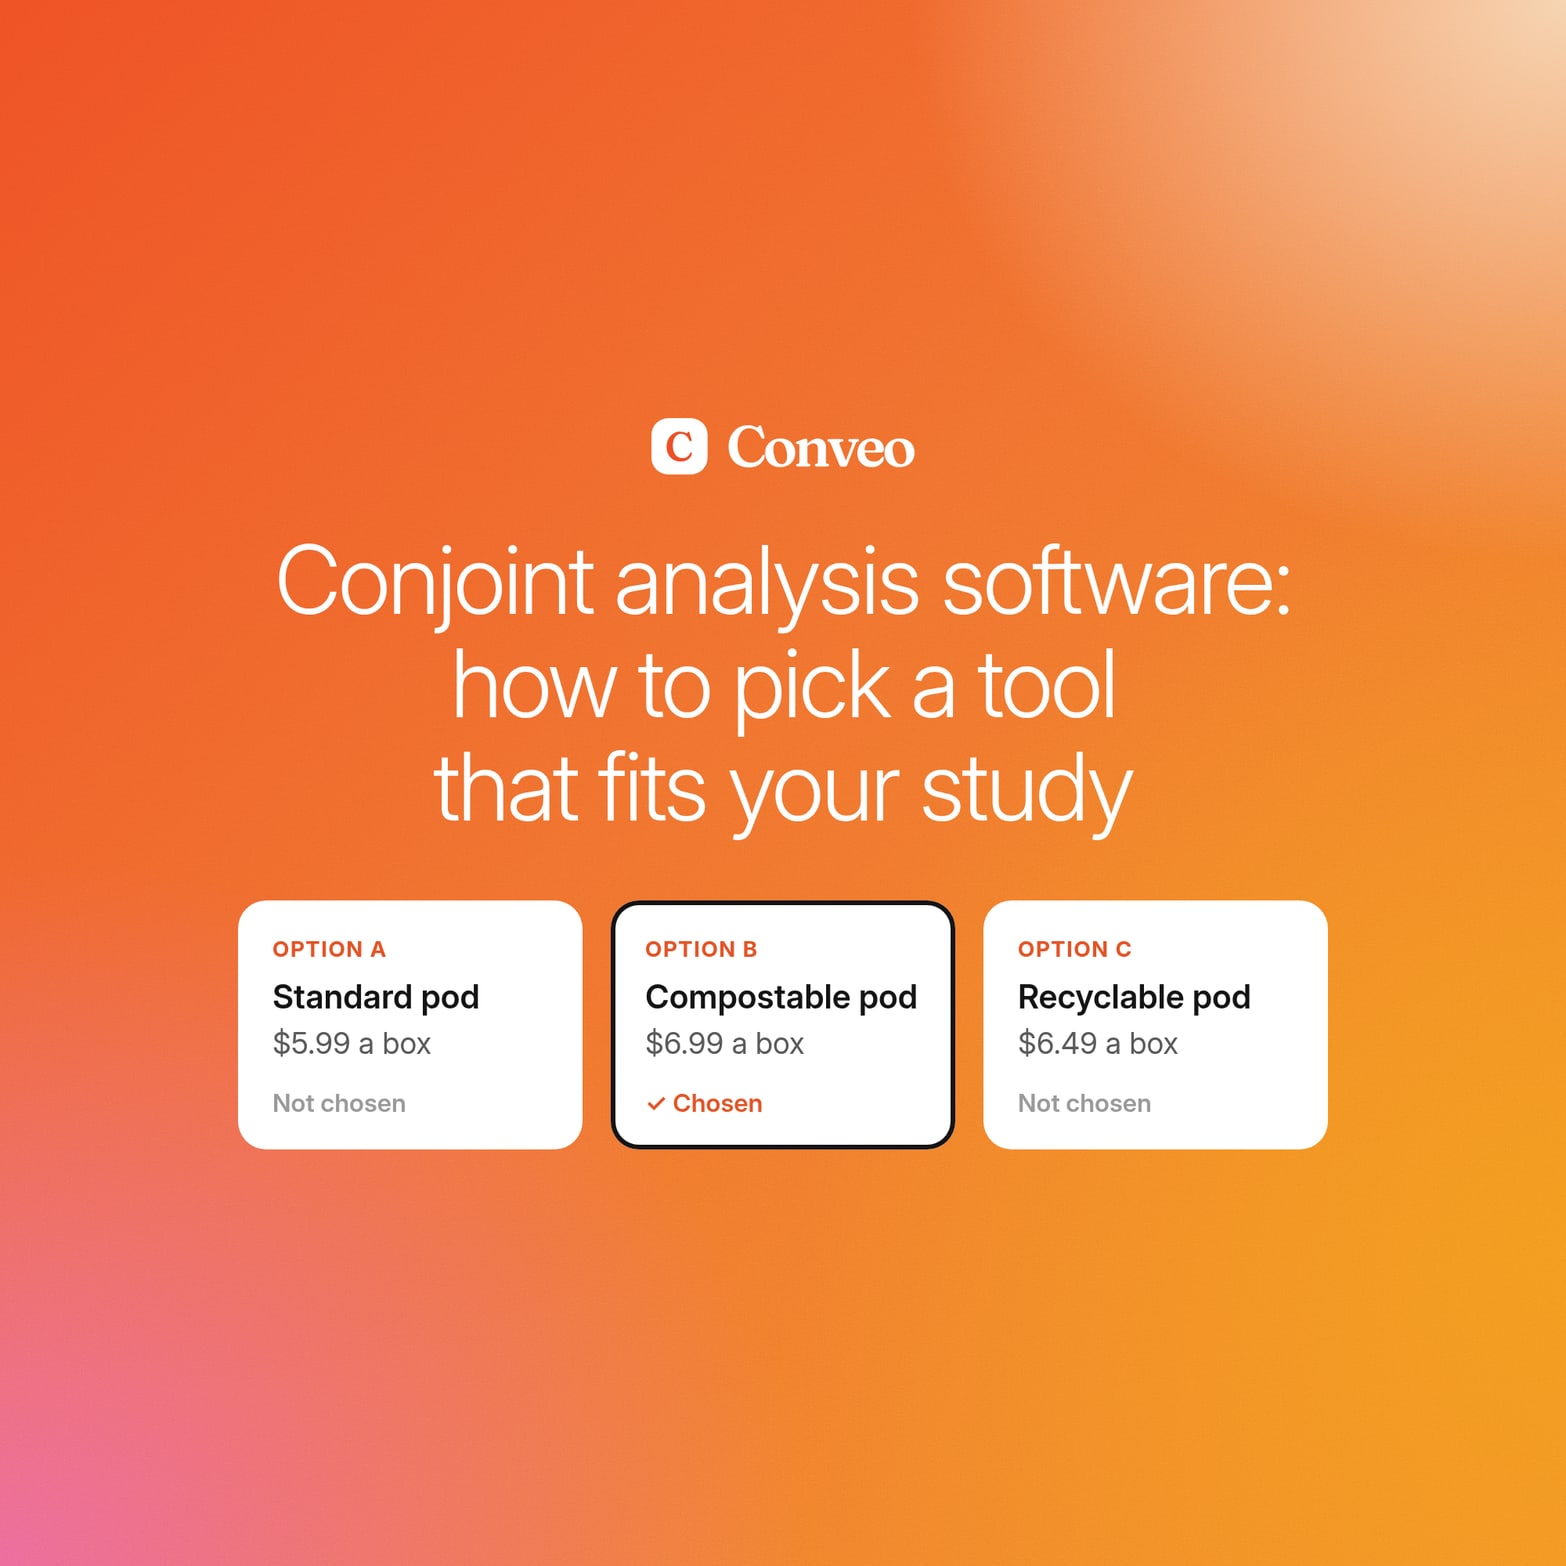
Conjoint analysis software estimates how much each product feature influences consumer preference. Researchers invite respondents to complete a series of choice tasks, each showing a few product versions with different features and price attributes. They choose the one they’d buy. The software uses those choices to produce two outputs:
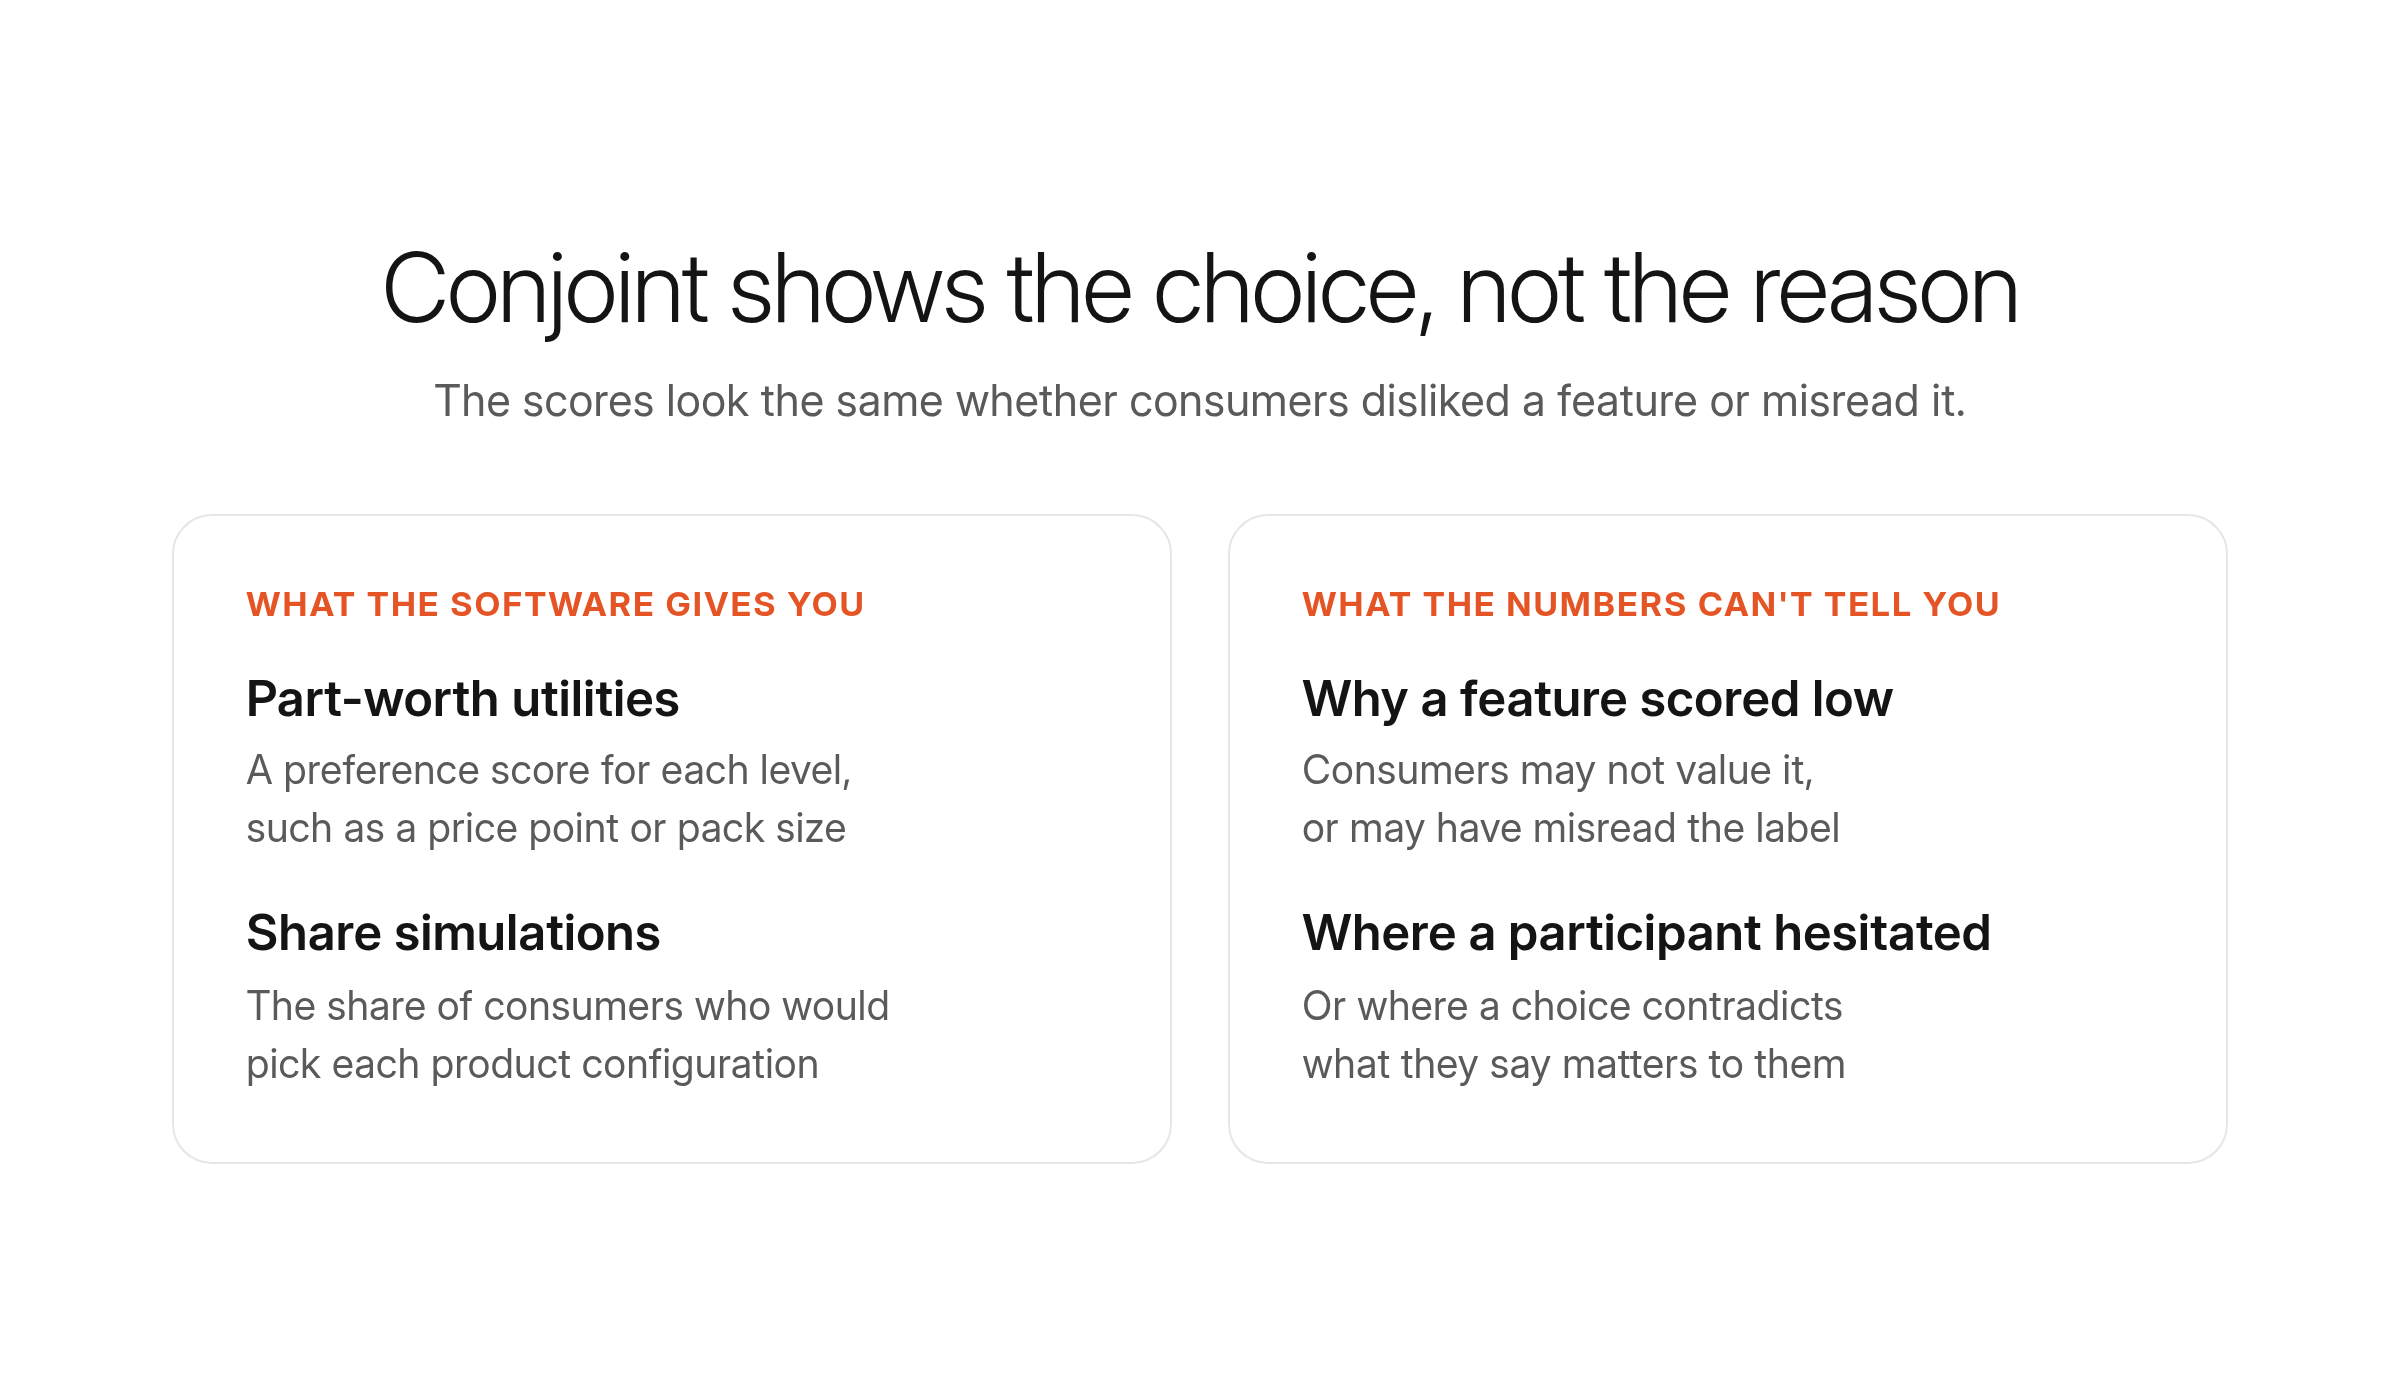
Part-worth utilities. A preference score for each attribute level, such as a price point or pack size, showing how it affects preference relative to other levels.
Share simulations. A model that estimates what share of consumers would choose one product configuration over competing options.
For example, a coffee brand might do market research to test a compostable pod at three prices. The part-worth utilities show how much preference changes as the price rises from $6.99 to $7.99 per box. The share simulator estimates how much market share the brand might retain if it launched the compostable pod at the higher price.
The problem is that conjoint shows what consumers choose, but not why. A low score for "compostable pod" could mean they don't value the feature, but it could also mean they misread the label. The data looks the same either way. The numbers also can't show where a participant hesitated, or where their choice contradicts what they say matters to them.
Tool categories: survey platforms, specialist conjoint tools, and qualitative research tools
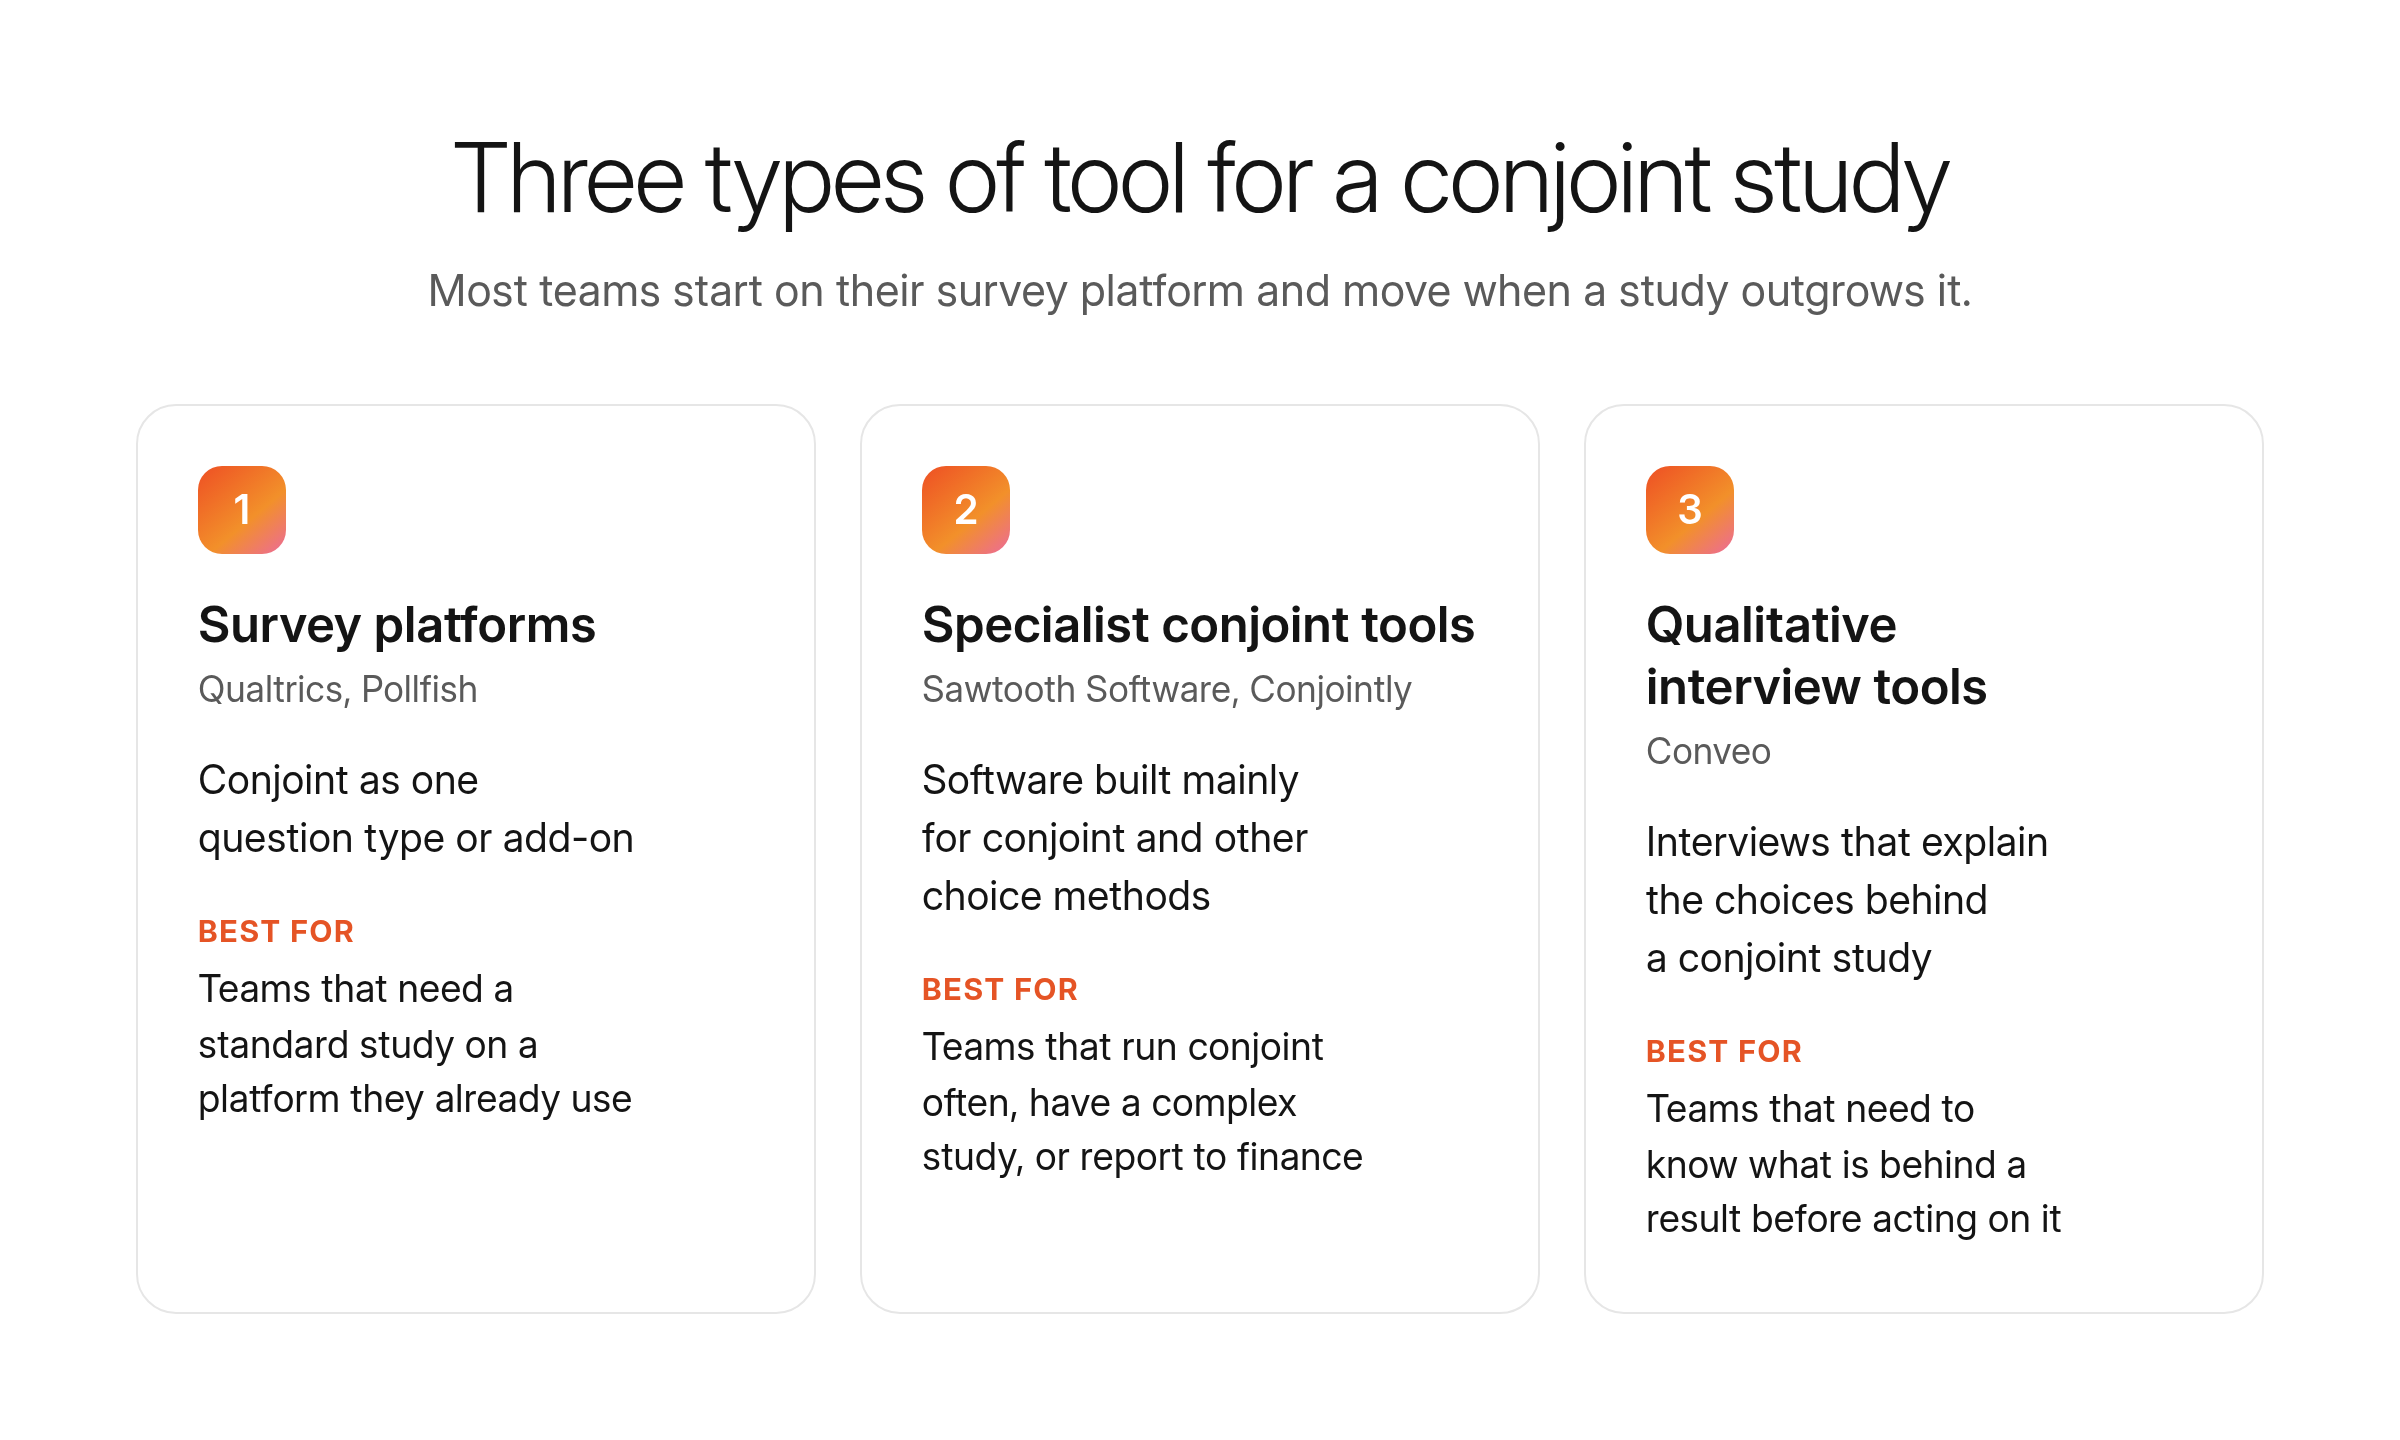
Conjoint studies can run on general survey platforms or specialist conjoint software. Teams can also use interview-led research tools to understand the reasoning behind the choices. Here’s how the three compare:
| Survey platforms | Specialist conjoint tools | Qualitative interview tools | |
|---|---|---|---|
| What it is | A general survey tool with conjoint as one of many question types or add-ons | Software built mainly for conjoint and related choice methods | Tools that interview consumers and analyze what they say, used alongside conjoint to pick relevant attributes or explain the results |
| Example platforms | Qualtrics, Pollfish | Sawtooth Software, Conjointly | Conveo |
| How much you can customize the study | Enough for a standard choice study built from a template | The most: more conjoint types, such as alternative-specific designs where some features only apply to one product, more control over which combinations appear and how many screens each person sees | MaxDiff and pricing questions inside the interview; not built for conjoint designs |
| How much of the math you can check | Results arrive ready-made in a dashboard, with fewer settings to change | You can see and adjust the model settings and export the scores for each participant | MaxDiff scores and price curves, plus each participant’s follow-up answers; no conjoint utilities or simulator |
| What you learn about why | Little. You can add open-text questions, but nobody follows up on the answers | Little, for the same reason | A lot. Consumers explain their choices in their own words and get follow-up questions |
| Best for | Teams that already run surveys there and need a standard study | Teams that run conjoint often, have a complex study, or need to defend the numbers to finance | Teams that need to know what’s behind a result before acting on it |
Most teams start on the survey platform they already pay for and move to a specialist tool when a study outgrows the template.
When a survey platform is enough
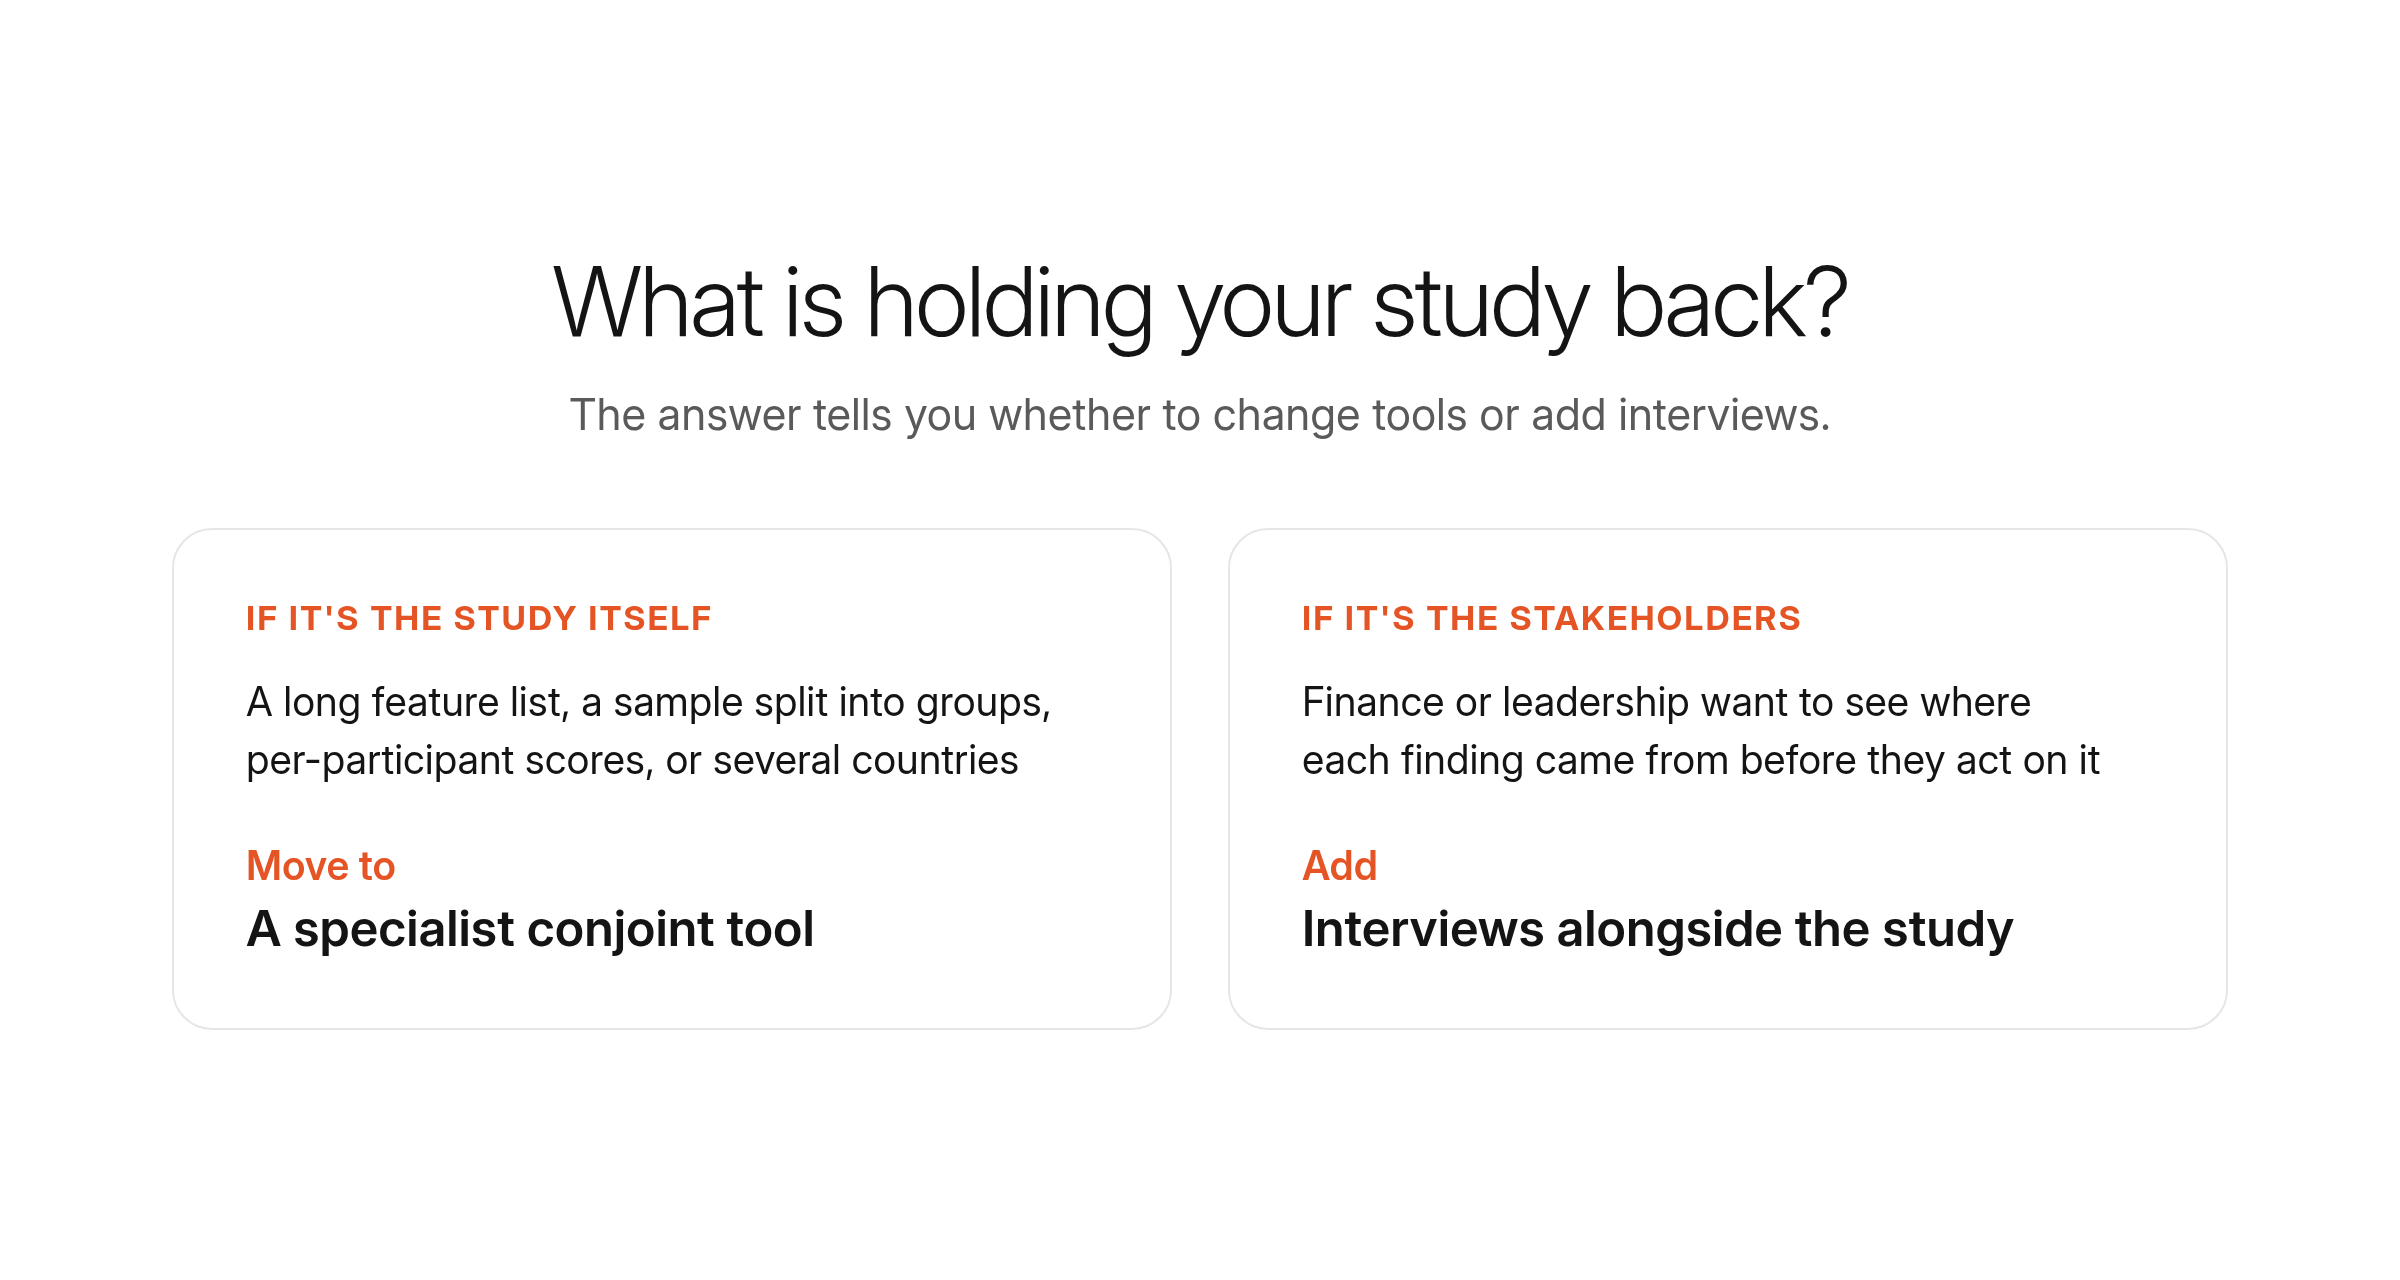
A team that runs one or two standard studies a year on a single product can usually stay on the survey platform it already has. If you’re running more, look for these signs that it’s time to move to a new tool:
| A survey platform is enough if… | You need more if… | |
|---|---|---|
| Study design | You’re testing one product with a handful of features and prices, using standard choice-based conjoint (CBC) | The feature list is long, or some features can’t appear together, and the study needs an adaptive design |
| Sample | You have fewer than 300 participants from one audience | You have a larger sample split into groups you want to compare |
| Scores | One set of scores for the whole sample answers the question | You need each participant’s scores to export, segment, or build your own models on |
| Markets | The study runs in one country and one language | It runs in several countries, with translated versions and data that has to stay in a specific region |
| Who sees the results | The insights team uses them internally | They go to other stakeholders like finance or leadership, who’ll ask where each finding came from |
If the design, sample size, scoring, or number of countries is what’s holding the study back, move to a specialist conjoint tool. If the pressure comes from stakeholders who want to see where a finding came from, add interviews alongside the study.
Conjoint analysis software evaluation criteria for enterprise buyers
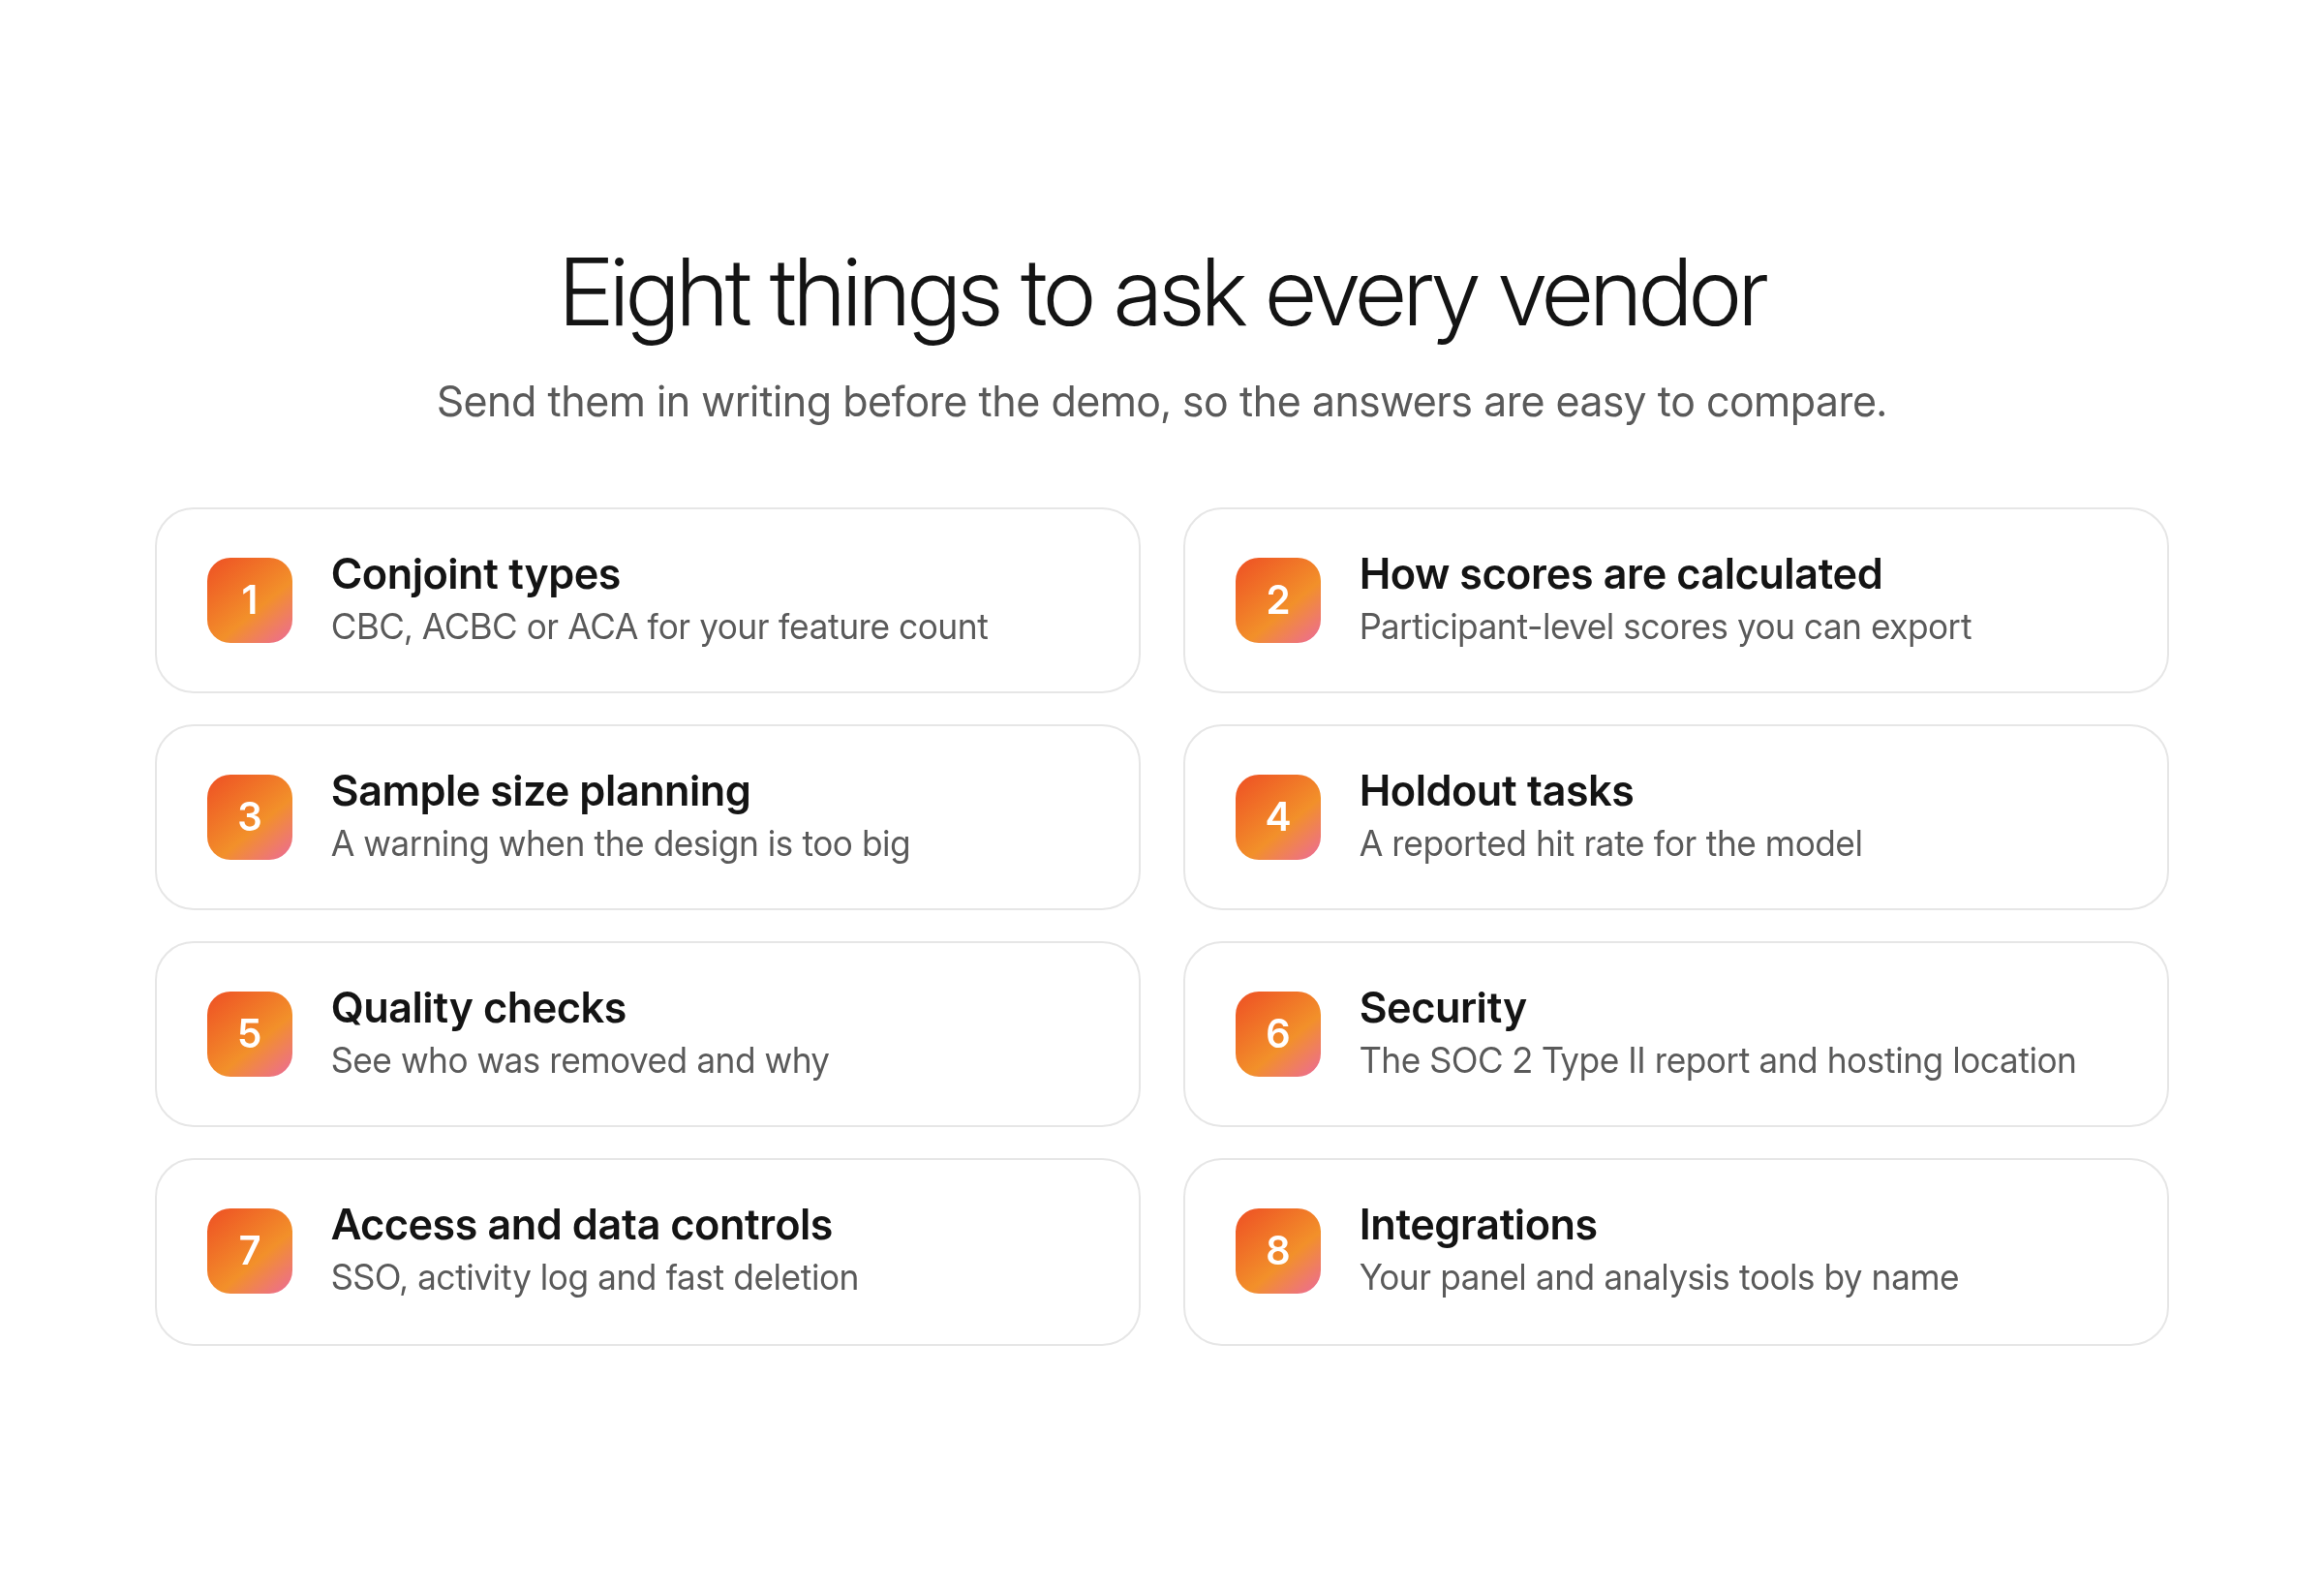
Whichever type of platform you go for, an enterprise purchase has to satisfy the analysts who have to trust the numbers and the IT and legal teams who have to approve the vendor. When evaluating your options, look for the following:
| What to check | Ask the vendor | Why it matters | How to judge the answer |
|---|---|---|---|
| Conjoint types. Choice-based conjoint analysis (CBC) is the standard, where participants pick one product from a set. Adaptive choice-based conjoint (ACBC) changes the questions based on earlier answers. Adaptive conjoint analysis (ACA) is an older, ratings-based method. | Which types do you support, and which would you use for a study with our number of features? | The wrong type asks participants to compare more than they can take in, and their answers get less reliable. | CBC is enough for most studies. If your products have long feature lists, shortlist only vendors with ACBC. Be wary of a vendor that recommends ACA for a pricing study. |
| How scores are calculated. Hierarchical Bayes (HB) gives every participant their own scores. Aggregate models give one set for the whole sample. | Do we get scores for each participant, and can we export them? | An average can hide two groups that want opposite things. | If you need to compare consumer groups, such as heavy and light buyers, rule out any tool that only gives aggregate scores. |
| Sample size planning. A study needs enough participants overall, and enough in each group you want to report on. | Does the tool tell us how many participants our design needs before we field it? | Without enough responses, the scores are too uncertain to set a price on. | A good tool warns you when the design is too big for the sample. If the vendor quotes one number for every study, your team will have to work it out themselves. |
| Holdout tasks. Extra choice questions kept out of the model and used to test its predictions. | Can we add holdout tasks, and do you report how well the model predicted them? | It's the standard check, within the study, that the model predicts choices it wasn't trained on. | Look for a reported hit rate. Without one, you have no evidence the simulator is accurate before the results go to pricing or finance. |
| Quality checks. Reports that flag participants who rushed or answered at random. | Which checks run automatically, and can we remove poor responses ourselves? | Rushed and random answers distort the scores. | You should be able to see who was removed and why, and rerun the results without them. Treat “we clean the data for you” with no detail as a no. |
| Security. SOC 2 Type II certification, GDPR compliance, and a choice of where data is stored. | Can we see the SOC 2 Type II report, and where will our data be hosted? | IT and legal won’t approve a vendor without it. | Ask for the report itself, not the badge on the website. If your company requires EU hosting, get the location in the contract. |
| Access and data controls. Single sign-on (SSO), a log of who viewed or changed a study, and deletion of a participant’s personal data on request. | How fast can you delete one participant’s data, and who can see the activity log? | Your company stays responsible for participants’ personal data while a vendor holds it. | GDPR gives you one month to act on a deletion request, so the vendor has to be faster than that. A process that runs through a support ticket with no deadline is a risk. |
| Integrations. Connections to the panel providers, analysis software, and reporting tools the team already uses. | Which panels and export formats do you support without custom work? | Every manual export and re-upload adds time and room for error. | Check your own panel provider and analysis software by name. “Available through our API” means your team builds and maintains it. |
Send these questions to each vendor in writing before the demo, so the answers are on record and easy to compare.
The attribute design problem most conjoint analysis tools don't solve
The attributes you use in a conjoint analysis study are the most important aspect of the study design, but most conjoint analysis software assumes you already know which features to test and how to word them.
Teams might choose attributes based on internal workshops or previous survey findings. But you risk testing features consumers don’t care about or describing them in ways consumers interpret differently than intended.
For example, a coffee brand might test “compostable” pods, meaning they can go in a home compost bin. Some consumers assume the pods need a special collection service and score them lower.
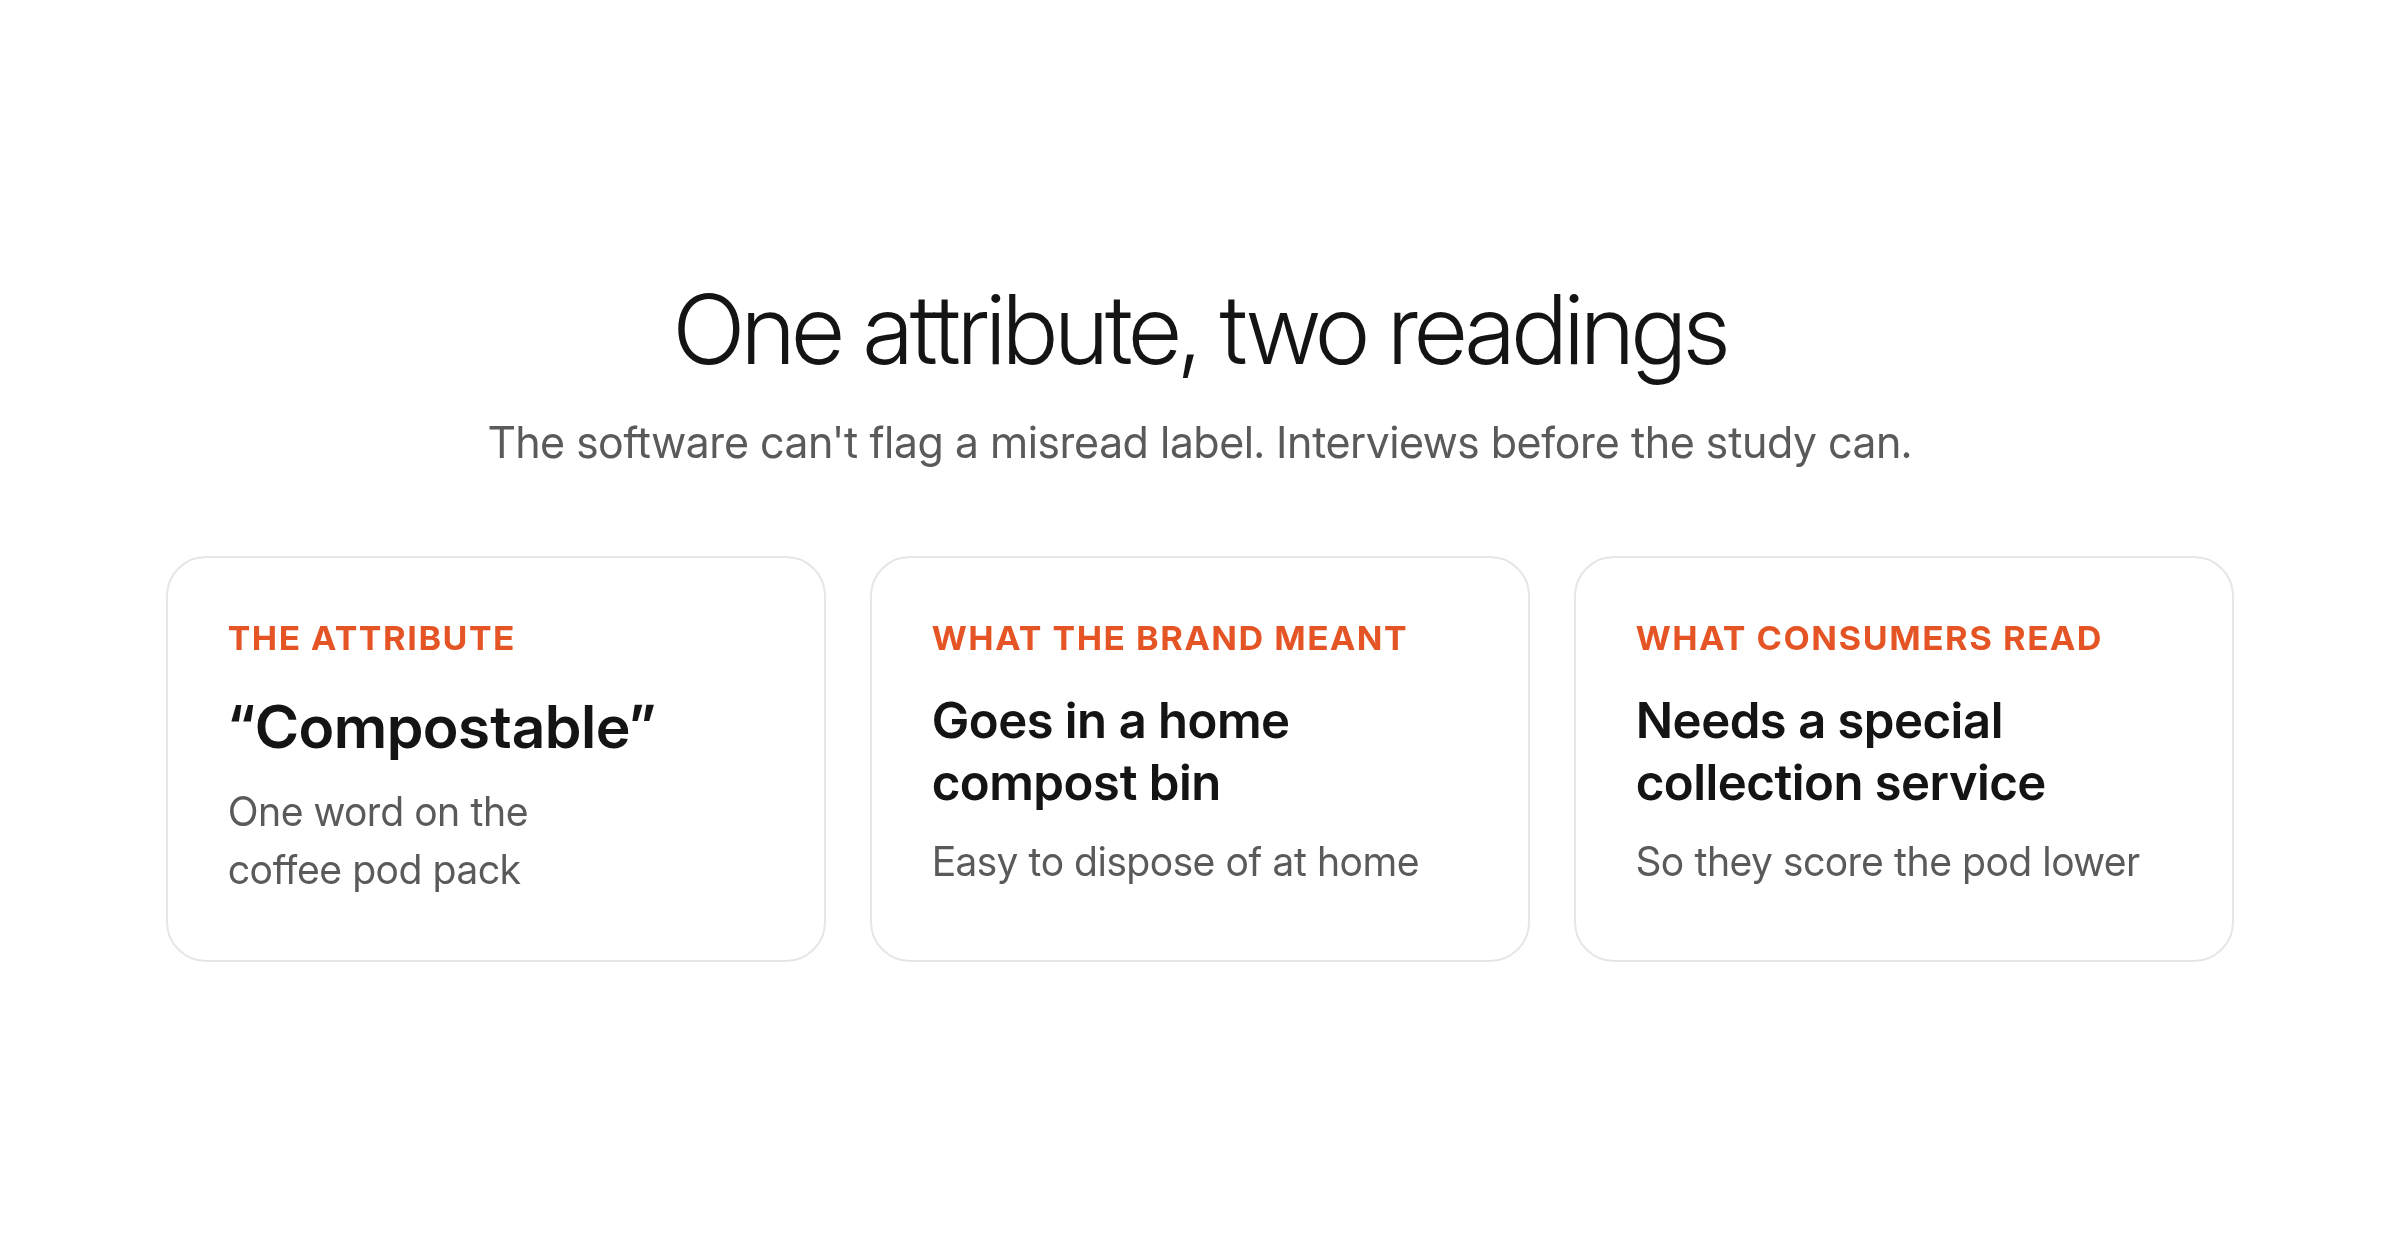
The software won’t flag this. The study runs, the scores come back, and you only see the problem once the fieldwork is done. To get the most relevant attributes from the start, interview consumers before you build the study. Ask how they choose between products in the category, then build your attribute list from what they say.
How qualitative work determines whether a conjoint is worth fielding
Qualitative research helps teams catch attributes that consumers misunderstand or don’t value before they field a conjoint study. Some platforms, like Conveo, combine those explanations with quantitative results from the same participants in the same session.
The qualitative part is a video interview. Consumers talk through how they choose between products in the category, and Conveo’s AI research assistant asks follow-up questions when an answer is vague or leaves a gap. If a consumer misreads “compostable” or doesn’t mention it at all, you find out before it goes into the study.
The quantitative part is a question added to the same interview. In Conveo, that can be a MaxDiff question, where participants pick the most and least important features from a list, and, as a newer feature, a Van Westendorp or Gabor-Granger pricing question. Participants answer, then explain their choices on video. If two or three features come out far ahead, you can shorten the attribute list and run a leaner conjoint.
See a Conveo AI-moderated interview in action:

What Conveo adds before and after a conjoint study
Conveo is Consumer Understanding Infrastructure: it runs AI-moderated video interviews with consumers and keeps every study in a searchable insight library. Insights teams at consumer brands can use it alongside conjoint analysis software tools to decide what goes into a study and to back up what comes out of it. Here’s what it helps you do:
Answer questions while the decision is still open. Researchers can investigate a question when it comes up, without waiting for a new project to be commissioned. With Conveo StoryLines, research runs in waves, for example every two weeks or monthly, and Conveo flags what’s shifted after each one. You’ll know if consumers’ priorities have moved since your last conjoint study.
Test features consumers care about. Interview consumers before you build the study, and take the attribute list from what they say and the words they use.
Get a ranking and the reasons in one interview. Add a MaxDiff or pricing question (currently in early access), and participants explain their answers on video straight after.
Show stakeholders where a finding came from. Each theme links to the video clips and quotes behind it, so pricing and finance leads can check it themselves.
Start the next study from what you already know. Every study lands in the searchable insight library. When the next pricing question comes up, the team can pull up what earlier interviews found.
Pass security review. Conveo is SOC 2 Type II certified and GDPR compliant, with EU hosting in Belgium.
Conveo suits insights teams whose conjoint results go to pricing, finance, or leadership and get questioned. If you run small, standard studies and the results stay within your team, the conjoint feature in your survey platform is probably all you need.
"The pace, responsiveness, and research expertise of the Conveo team, on top of the top AI-moderated qual platform, have been invaluable to us in scaling brand advertising internationally."
Matt Harris, Research & Insights Lead, EMEA, Canva
Frequently asked questions
We already have a survey platform with a conjoint feature. Why would we need another tool?
You might not. If you run standard conjoint analysis surveys on a few product attributes and the results stay within your team, your survey platform is enough. Teams add a specialist tool when their studies need advanced features, and add interviews when they aren’t sure which attributes to test or when stakeholders question the results.
Can you run conjoint analysis in Qualtrics or SurveyMonkey?
For conjoint analysis, Qualtrics sells conjoint projects as an additional purchase, and Qualtrics conjoint analysis uses a choice-based design. SurveyMonkey conjoint analysis isn’t currently available, but it offers MaxDiff for ranking features.
What is conjoint analysis software used for?
Conjoint analysis can be effective for both product development and market research and includes applications such as feature prioritization, pricing strategy, and market forecasting. It shows how consumers make trade-offs between features and price, and which combination they prefer. The utility scores can also be used to estimate willingness to pay and how a new product would perform against competing products.
How does conjoint analysis software calculate the value of each feature?
Many tools use a statistical model called multinomial logit. It looks at which product each participant picked in every choice task, and works out how much each feature level, such as a price point or pack size, raised or lowered the chance of that product being picked. Those estimates are the part-worth utilities. Some tools also use hierarchical Bayes, which gives each participant their own set of scores, so you can compare results between consumer groups.
How much does conjoint analysis software cost?
Cost varies widely. Some tools have a free tier limited to a small number of respondents, usually between 25 and 50, though most platforms require payment before building a conjoint survey. They sometimes charge per response, starting at around a dollar, or sell annual team plans for a few thousand dollars.
Is conjoint analysis software hard to learn?
It depends on the tool. Survey platforms with a conjoint question type are quick to set up, because the experimental design is handled for you. Other tools, like those specifically made for full profile conjoint analysis, have a steeper learning curve. They let experienced researchers control the design, for example by setting prohibited pairs so that feature combinations that don’t make sense never appear together.

About the author
Dieter De Mesmaeker
Co-Founder & CEO
Dieter is CEO and co-founder of Conveo. Before starting the company, he founded DataCamp and scaled it into one of the leading edtech platforms in the world.
More by Dieter →