In this article
TL;DR
Conjoint analysis is used in market research to show how much value consumers place on different attributes of a product or service.
It's most useful when consumers have to weigh competing options, such as choosing between a lower price and more features.
Conjoint results show which product features people value most and how much price they'd trade for those features, helping insights teams make pricing and product design decisions.
Follow-up interviews with Conveo explain why participants chose what they did, making recommendations easier to defend.
When you need to decide which features a product should have or how much to charge, rating scales won't give you a clear answer. Asked to rate features one at a time, consumers tend to score most of them highly, which leaves you guessing which ones they'd trade away.
For insights teams at consumer brands, conjoint analysis solves this by asking people to pick between versions that combine features differently, so getting one feature means giving up another.
This guide walks through conjoint analysis from study design to results. You'll learn when to use conjoint, the main types of conjoint, how to choose attributes and levels, how to structure choice tasks, and how to interpret the results.
What Conjoint Analysis Measures
Conjoint analysis measures the value consumers place on different product features when they have to make trade-offs between them. Participants see several versions of the same product, each with a different mix of features and prices, and pick the one they'd choose. A statistical model uses the pattern of choices to estimate how much each feature contributes to preference.
For example, say a yogurt brand wants to know whether switching to recyclable paper cups would justify a higher price. Participants are shown three versions of the same yogurt and asked, "Which would you be most likely to buy?"
| Attribute | Option A | Option B | Option C |
|---|---|---|---|
| Cups | Plastic | Recyclable paper | Recyclable paper |
| Price (4-pack) | $3.49 | $3.99 | $4.49 |
They choose one option, then move to the next screen, where the yogurt options have different combinations of cup type and price. For example, the next task might compare plastic cups at $4.49 with recyclable paper at $3.49 and $3.99.
Rating scales tend to make every feature look important. Ask people to rate recyclable packaging from one to 10, and most may give it a high score because choosing it costs them nothing. A choice task forces a trade-off: choosing the more sustainable option may mean paying more or giving up another feature. That shows what people prioritize when they have to choose.
When to Use Conjoint (and When Another Method Fits Better)
Conjoint analysis works best when several attributes change at once, like features and price, and you need to understand what each one contributes to a person's choice. Common use cases include configuring a new launch, deciding which features to prioritize, testing price points, and simulating how changes to an offer could affect preference.
When Another Analysis Method May Fit Better
Conjoint analysis is one of several methods for measuring preferences. If you need to analyze what people said in interviews, content analysis and thematic analysis are the methods to compare. If your preference question is narrower, a simpler method may answer it with a smaller sample and a less complex study design.
| Method | Best for | Output | Limitation |
|---|---|---|---|
| Conjoint analysis | Pricing and product decisions where several features change at once | A score for each feature option, plus a simulator for testing new product versions | Needs a larger sample and careful design. Shows which options people choose, but the choice task doesn't capture why. |
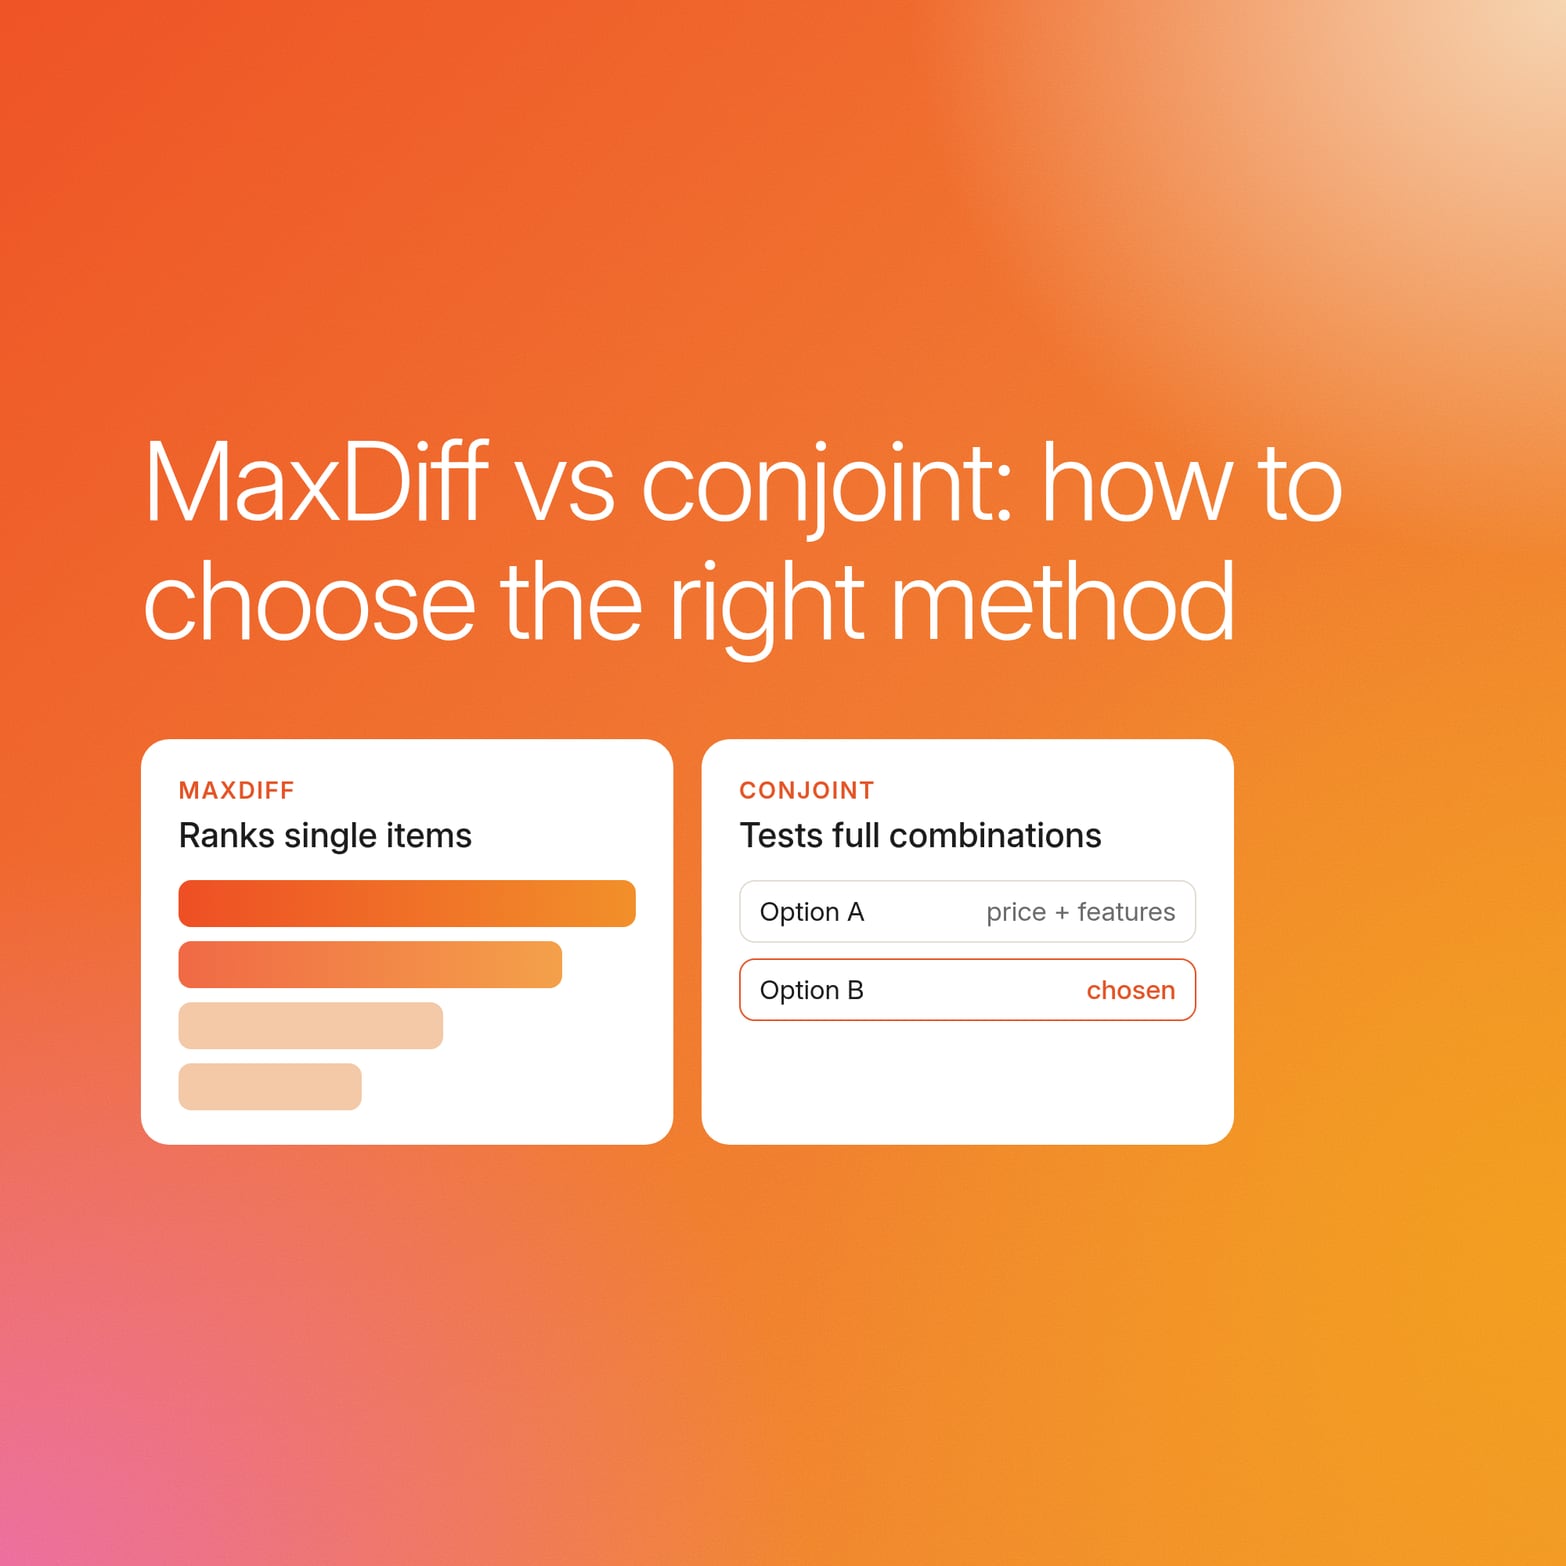
| MaxDiff | Ranking a long list of features or claims by importance | A preference score for each item on the list | Compares items against each other without attaching a price. Shows the order of preference, but doesn't capture why. |
| Van Westendorp | Finding an acceptable price range for a single product | A price range between "too cheap" and "too expensive" | Tests price on its own. Relies on stated price perceptions, which can differ from actual purchase behavior. |
| Ranking | Sorting a short list quickly | An order of preference | Shows the order without indicating how far apart items are. Gets harder to interpret as the list gets longer. |
Conveo runs MaxDiff inside the interview, so the ranking task and the video follow-ups happen in the same session: after the choice tasks, the AI research assistant asks each participant why their best and worst items landed where they did. For price ranges, see our guide to the Van Westendorp price sensitivity meter.
3 Types of Conjoint Analysis Methods
The three main types of conjoint analysis differ in how participants give their answers. That affects how many features a study can handle and how close the task feels to a real purchase.
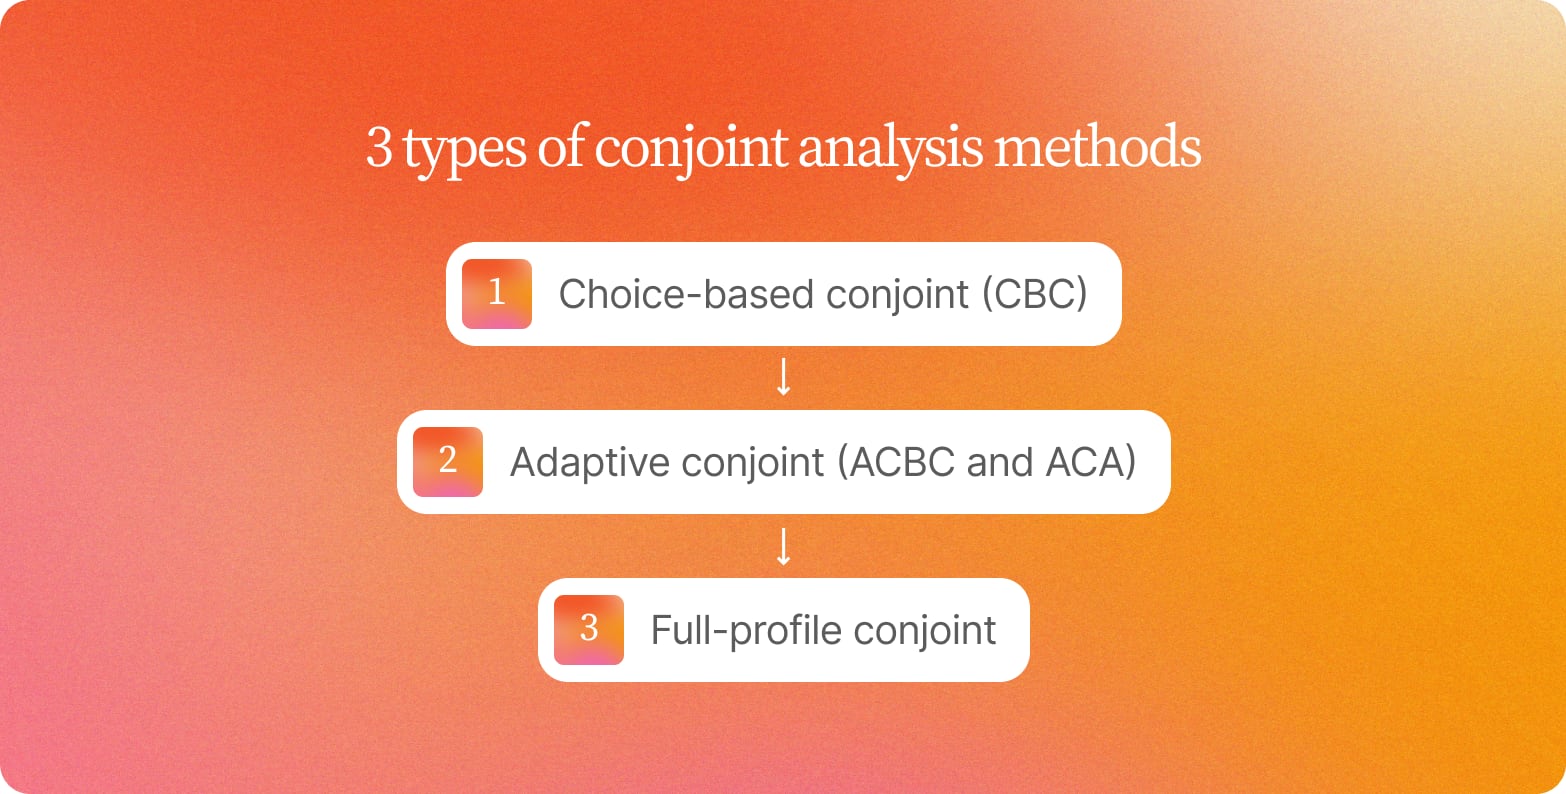
1. Choice-Based Conjoint (CBC)
Choice-based conjoint, also called discrete choice, is the most widely used type of conjoint analysis. Participants see several complete products on each screen and pick the one they'd buy, often with the option to choose none of them. The task works like choosing from a shelf, which is why CBC is a common choice for pricing and product decisions.
CBC gets harder to use as features are added. Every feature adds another line to each product on the screen, and past a certain point participants start skimming.
2. Adaptive Conjoint (ACBC and ACA)
Adaptive conjoint changes the questions based on each participant's earlier answers. For example, a participant who says they'd never pay more than $30 for a moisturizer won't see $45 options later on. The study then focuses on the products that person would actually consider.
Adaptive choice-based conjoint (ACBC) is the more modern approach. The original adaptive conjoint analysis (ACA) dates from the 1980s and is now considered a legacy method, accounting for only about 2% of conjoint projects.
3. Full-Profile Conjoint
Full-profile conjoint shows participants one complete product at a time and asks them to rate it, such as how likely they'd be to buy it on a scale of one to 10. Some versions ask participants to rank a set of product cards instead.
It's the oldest form of conjoint and suits small studies with only a few features. Rating products one at a time is less like a real purchase than choosing between them, so most teams now use CBC for pricing work.
How to Design a Conjoint Study: 4 Steps
Most of the work in a conjoint analysis study happens before the conjoint survey goes live. These steps follow the order you'll work in, from choosing relevant attributes to setting the sample size.
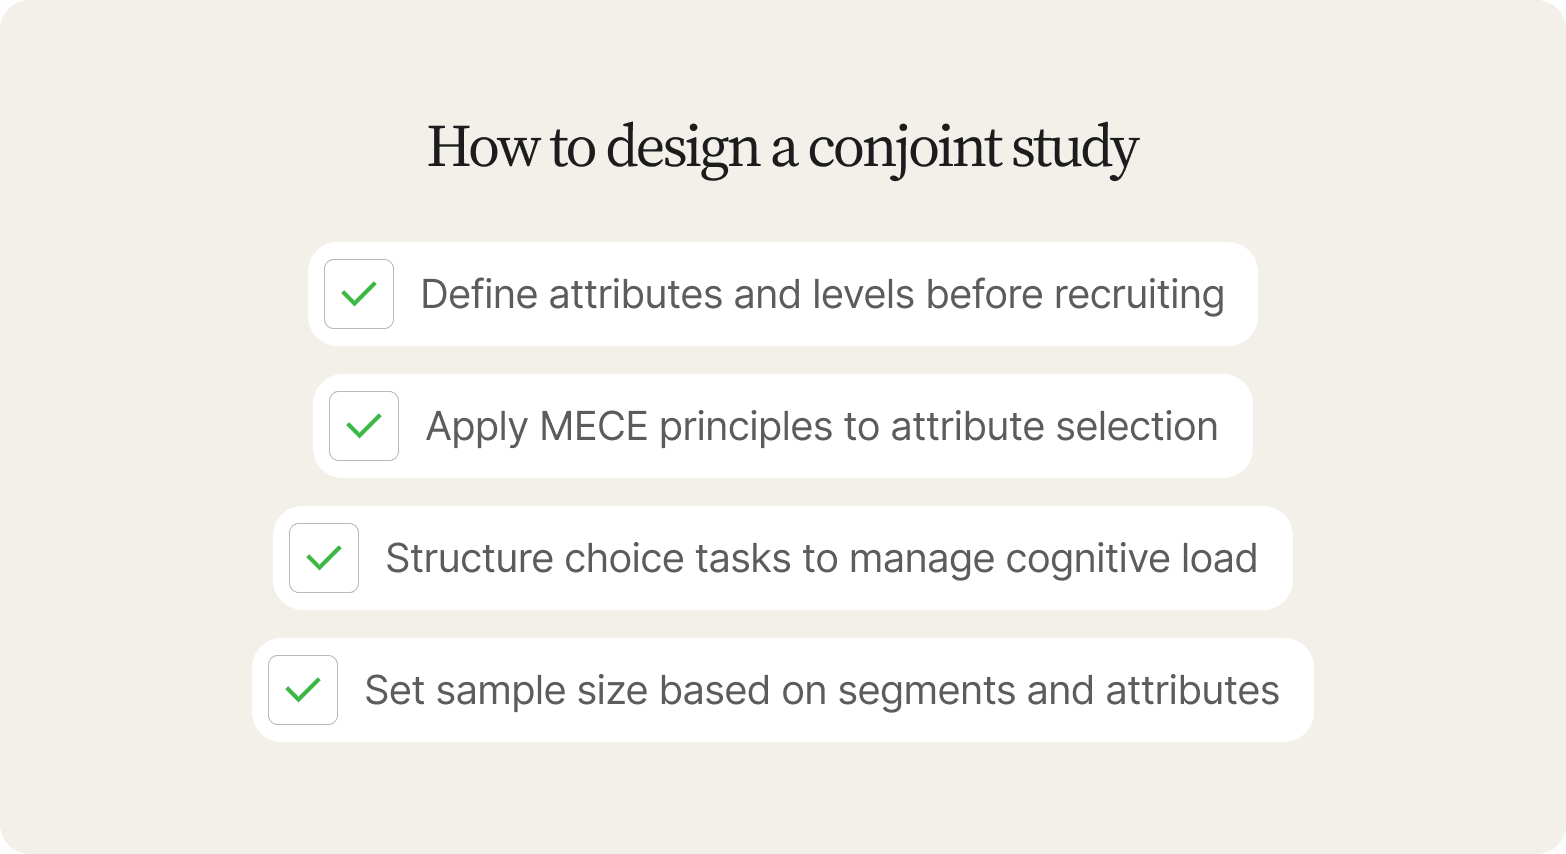
1. Define Attributes and Levels Before Recruiting
Attributes are the features you want to test, like price or pack size. Levels are the options within each attribute, like $3.49 or $3.99 for price. The list can't change once fieldwork starts, so settle it before you recruit anyone.
Most studies test four to eight attributes with two to five levels each. With more than that, each product on the screen gets too long to compare, so participants start choosing on one or two features, like price, and ignoring the rest. Qualitative interviews help you choose which ones make the list. They show which features people compare when they choose between products, and which prices they see as realistic.
For example, interviews for a pet food brand might show that owners check where the ingredients come from. The team can then add ingredient sourcing as an attribute, with levels such as "US-sourced" and "imported," before the study goes live.
2. Apply MECE Principles to Attribute Selection
MECE stands for mutually exclusive and collectively exhaustive. Each attribute should measure one distinct factor, and the levels within each attribute should cover the realistic options. Here are the problems to check for and how to fix them:
| Problem | Weak attribute | Stronger version |
|---|---|---|
| One attribute combines different factors | "Quality" with levels Premium, Organic, Standard | Two attributes: "Organic" (yes/no) and "Range" (premium/standard) |
| Two attributes measure the same factor | "Price" and "Value for money" as separate attributes | "Price" only, since the study measures how participants trade price against other attributes |
3. Structure Choice Tasks to Manage Cognitive Load
Each screen in a choice-based conjoint study is a choice task, where participants see a few versions of the product and pick one. Participants need to compare products as carefully on the last screen as on the first, so keep each task simple.
A good guideline is to show three to five products per screen, and keep the study to around eight to 12 tasks per participant. Also check that no product on a screen is better on every attribute and cheaper, because everyone will pick it and that task tells you nothing.
Keep the layout the same on every screen, so price and the other attributes always sit in the same place. If you randomize attribute order to stop the top line getting extra attention, do it between participants and keep the order fixed for each one.
Before full fieldwork, run the survey with a small group. Check that participants understand what they're choosing between and how long the study takes.
4. Set Sample Size Based on Segments and Attributes
Every level needs to appear often enough for the model to give it a stable score. When the sample is too small, the scores shift each time the data is cut a different way, and stakeholders stop trusting the results.
Sawtooth Software, a quantitative research platform, suggests at least 300 participants per study, with at least 200 in each segment you want to report on separately.
Increase the sample as the design gets bigger. Attributes with more levels need more participants, because each level appears on fewer screens. The same applies if you cut the number of tasks each participant completes.
How to Interpret Conjoint Analysis Results
Conjoint analysis results tell you what each feature is worth to participants and how they might choose between different product configurations. Here are the three main outputs and how to interpret them.
1. Part-Worth Utilities: How Does Each Level Affect Preference?
Each level gets a score, called a part-worth utility, that shows how much it raised or lowered a product's appeal. A higher score means more appealing, while a negative score means the level is less appealing than the other levels in that attribute. In a study for a yogurt brand, the scores might look like this:
| Attribute | Level | Part-worth utility |
|---|---|---|
| Cups | Plastic | -0.4 |
| Cups | Paper | +0.4 |
| Price | $3.49 | +0.8 |
| Price | $3.99 | +0.1 |
| Price | $4.49 | -0.9 |
The numbers have no unit, so you read them by comparing the gaps between levels. Switching from plastic to paper adds 0.8 utility, while dropping the price from $3.99 to $3.49 adds 0.7. So paper cups lift preference slightly more than a 50-cent price cut does.
2. Attribute Importance: Which Attributes Have the Most Influence?
Attribute importance shows how much each attribute affected participants' choices compared with the others. It's calculated from the gap between the highest and lowest utility in each attribute, as a share of all the gaps added together. In the yogurt study, price has a gap of 1.7 and cups have a gap of 0.8, so price accounts for 68% of the total importance and cups for 32%.
Importance depends on the levels you tested. If the study had included a $5.49 price, the price gap would be wider and price could account for a larger share of the total importance. Small differences may also be within the margin of error, so treat two attributes at 24% and 21% as roughly equal.
3. Market Simulation: What Happens When You Combine Levels?
A market simulator combines the utilities for different levels to estimate how participants would choose between complete product configurations. The $3.99 paper pack scores 0.5 and the $3.49 plastic pack scores 0.4, so when the two are compared, the simulator might predict that the paper pack receives about 52% of choices.
Raise the paper pack to $4.49 and its score drops to -0.5, and its predicted share falls to about 29%. You can use scenarios like these to see how changing price or features affects the predicted choice share.
The simulator can only test levels that were included in the study, so it can't reliably predict what happens at $5.49 if $4.49 was the highest price tested. Real-world results can also differ because of other factors such as awareness and competition.
All of these outputs describe what participants chose. To understand why they made those choices, you need another source of evidence, such as video interviews or other qualitative research.
Getting the 'Why' Behind Conjoint Results
Short follow-up interviews explain surprising patterns in your conjoint results. Run them after the first results are in, so you can focus on findings stakeholders are most likely to question, such as a sharp change in predicted choice at a higher price or a feature that had less influence than expected.
Say in the yogurt study, the simulator shows predicted choice for the paper pack dropping sharply at $4.49. Interviews can explore why participants reject the higher price. For example:
Budget. The price is above what they normally spend on yogurt.
Perceived value. They don't think paper cups are worth paying more for.
Those answers point to different decisions. A budget limit suggests holding the price, while a perceived-value issue could point to clearer messaging about the benefit.
Interviews also show when the choice task is forcing a trade-off that might not matter in a real purchase. Someone who doesn't care about cups still has to pick a pack on every screen. Asking participants to talk through a few of their choices shows which features they considered and whether they would make the same trade-off when spending their own money.
Video interviews add context to those answers. A participant who pauses before choosing the $4.49 pack, or sounds unsure when explaining the choice, gives you a reason to examine that preference more closely.
See it in action: here is how the AI research assistant probes a concept reaction.

5 Common Conjoint Analysis Mistakes and How to Avoid Them
Each of these conjoint analysis mistakes shows up once a team tries to act on the results. You can prevent every one of them with planning before fieldwork starts.
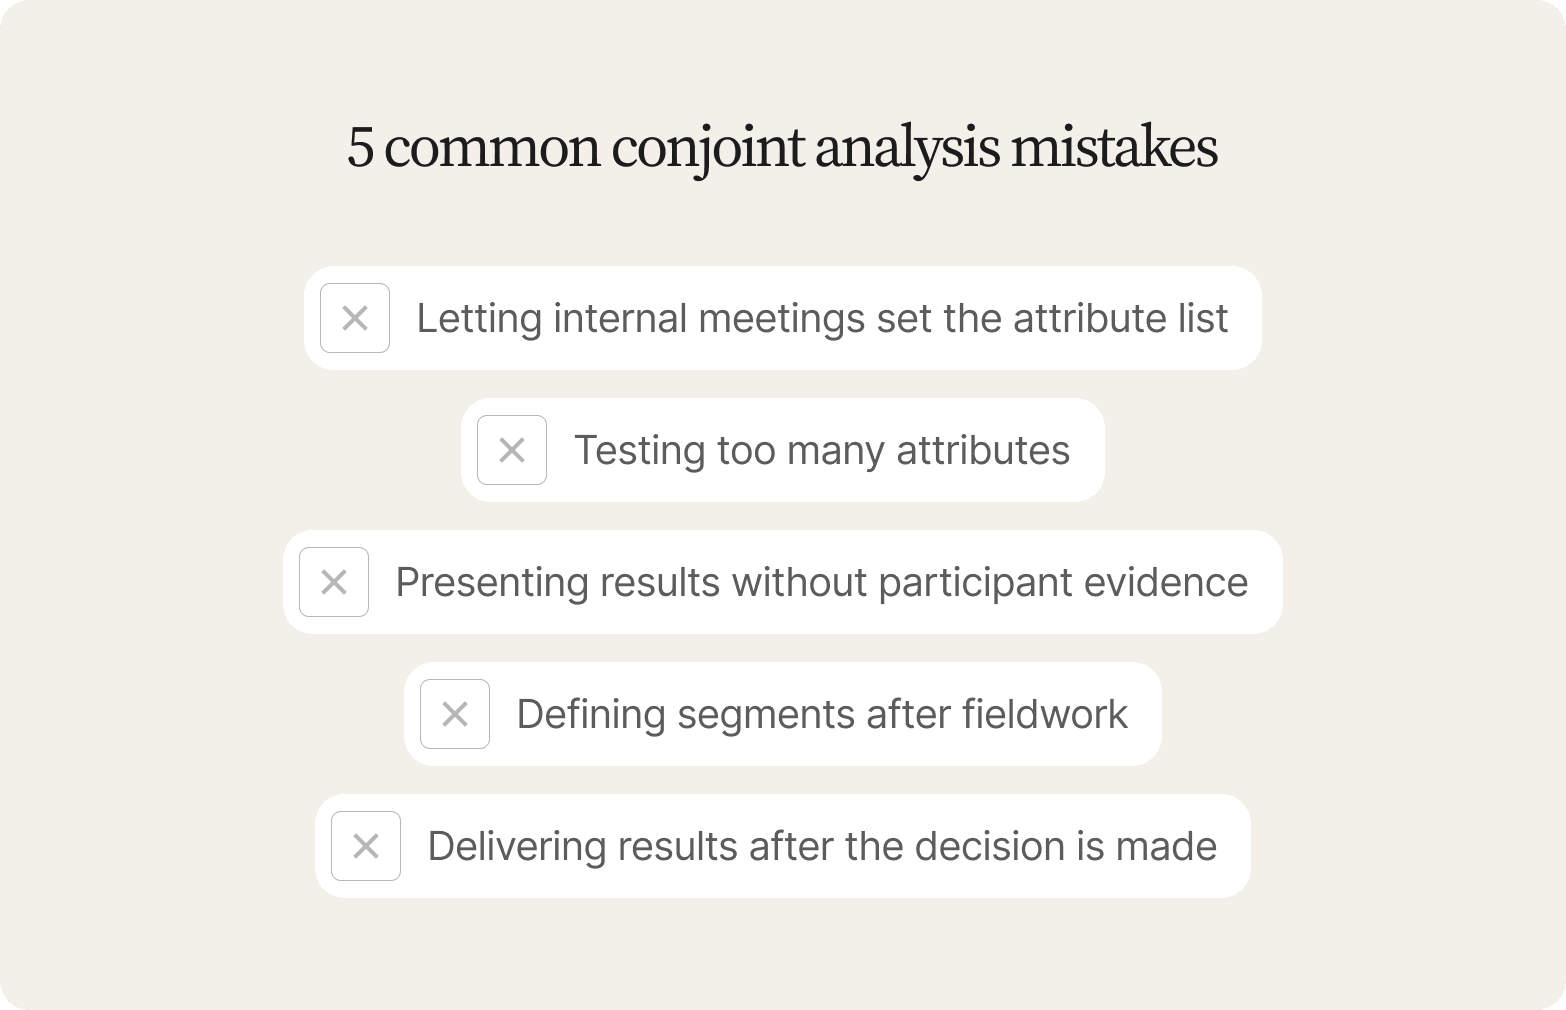
1. Letting Internal Meetings Set the Attribute List
When the attribute list comes out of internal meetings, the results often show that the feature the team argued hardest for barely moved participants' choices. Meanwhile, the feature participants actually compare products on never made it into the study, so there's no score for it.
Define your segments by behavior first, like how often people buy the category. Then run five to 15 interviews per segment and add any feature participants bring up on their own before you finalize the list.
2. Testing Too Many Attributes
When each product on the screen lists too many attributes, participants stop reading every line. They choose on price or brand, and the other attributes come out with scores close to zero whether they matter or not.
To cut the list without losing what the decision needs:
Remove any attribute whose result wouldn't change the decision
Merge attributes that measure the same thing, like "quality" and "premium range"
Leave out features every product will have, and state them as fixed on the screen
If you still have more than eight attributes, split the study in two or use an adaptive design like ACBC
3. Presenting Results Without Participant Evidence
A slide saying participants value recyclable packaging at a little over 50 cents invites the question of how the model knows. If the only answer is a statistical explanation, stakeholders treat the number as a black box and fall back on their own instincts.
Pair each finding with evidence from follow-up interviews, like a timestamped video clip or a quote from a participant explaining the trade-off. Stakeholders can then check the finding for themselves.
4. Defining Segments After Fieldwork
Splitting participants into segments based on their conjoint answers can produce groups that make sense in the data but can't be found again. A segment like "price-sensitive sustainability seekers" has no screening question, so you can't recruit it for the next study or target it in a campaign.
Define segments by behavior before fieldwork, such as which brand people buy now, and screen for them during recruitment. This also sets your sample size, since each segment you report on needs at least 200 participants.
5. Delivering Results After the Decision Is Made
Pricing and launch decisions run on their own schedule. When fieldwork and follow-up interviews run one after the other, the results can arrive after the team has already informally agreed on a price, and the study ends up justifying a decision that's already been made.
Start from the decision date and plan backward. Asynchronous AI-moderated video interviews let you interview every segment at once, since participants answer in their own time with no calls to schedule.
Considerations Before You Commit to a Conjoint Study
A conjoint study takes more budget and planning than most surveys, so settle the practical questions before you start. The most important one is which decision the study needs to inform, because that decides which attributes and segments belong in it.
Before you commit, check that:
The team agrees on the decision. Write it down as one question, like "Should the refill pack launch at $12 or $15?", and get sign-off before anyone designs the attribute list.
The budget covers every segment. At around 200 participants per segment, reporting on four segments means recruiting about 800 people.
Someone can run the analysis. Building the choice tasks and calculating utilities needs specialist software like Sawtooth, plus someone who knows how to use it, in-house or through a partner.
The qualitative follow-ups are planned. Stakeholders will ask why participants chose what they did, and the interviews need to be scheduled around the conjoint fieldwork.
Skipping the follow-ups to save time often costs more later, because the same questions come up in meeting after meeting once the results are out.
Why Insights Teams Use Conveo Alongside Conjoint Analysis
Conveo runs the qualitative research around a conjoint study, from the interviews that shape the attribute list to the follow-ups that explain the results. Every study stays in one place, so each new pricing or product question starts from what the team already knows. Here's how:
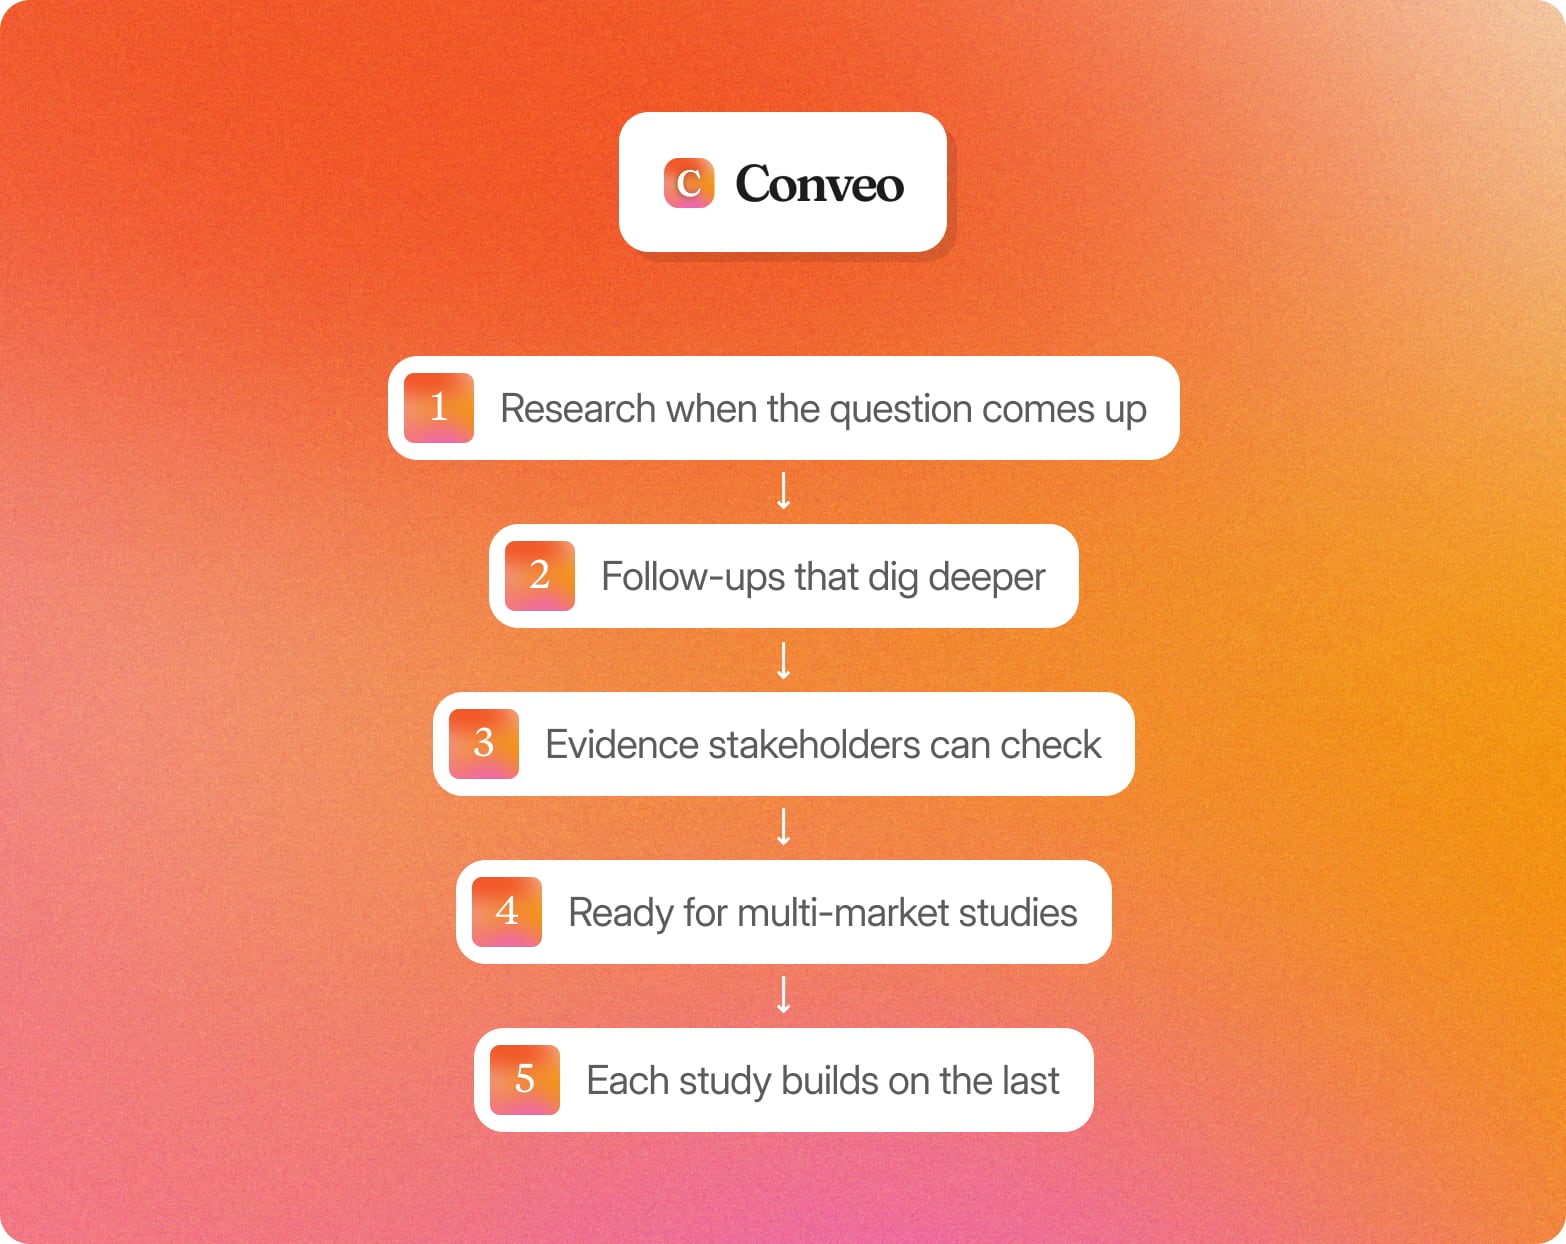
Research when the question comes up. Pricing and bundling questions come up throughout the year. Researchers can investigate each one as it arises, so findings arrive while the decision is still open.
Follow-ups that dig deeper. Conveo's AI research assistant asks follow-up questions when an answer is vague or leaves a gap, building on what the participant said earlier.
Evidence stakeholders can check. Every theme links back to the participants behind it, with the video clip and quote. A stakeholder questioning a price ceiling can watch participants explain it.
Ready for multi-market studies. AI-moderated video interviews run in 50+ languages, and Conveo is SOC 2 Type II and GDPR compliant, with data hosted in Europe.
Each study builds on the last. Every study lands in Conveo's searchable insight library, so when the next conjoint study needs an attribute list, the team can pull up what earlier interviews found.
Conjoint analysis shows what participants chose, and traceable interview evidence shows why. Together, they give pricing and product decisions the support they need when stakeholders question them.
"The pace, responsiveness, and research expertise of the Conveo team, on top of the top AI-moderated qual platform, have been invaluable to us in scaling brand advertising internationally."
Matt Harris, Research & Insights Lead, EMEA, Canva
Frequently asked questions
What's the simplest conjoint analysis definition?
Most researchers define conjoint analysis as a survey method that measures how much value people place on each feature of a product or service. The conjoint analysis meaning comes from how products are shown to participants: each one is a set of features joined together, or conjoined, like a price and a pack size.
What is the conjoint analysis formula?
Most studies use a conjoint model called multinomial logit, often estimated with hierarchical Bayes, to calculate a part-worth utility for each level from the conjoint data. A product's total utility is the sum of its part-worths. Its predicted share is e raised to that utility, divided by the same value added up across every product in the set. Conjoint software runs this statistical analysis, so market researchers rarely work through the formula by hand.
What is conjoint analysis in psychology?
Conjoint analysis started in mathematical psychology. In the 1960s, researchers developed conjoint measurement to study how people combine several factors into a single judgment. Marketing researchers adapted it in the early 1970s to measure consumer preferences for product attributes, and it's now used in both academic research and commercial pricing research.
What tools are used for conjoint analysis?
Sawtooth Software, Qualtrics and Conjointly are the most common tools. Each one covers designing the conjoint analysis survey and the statistical analysis afterward, including market share simulations. Teams that don't run conjoint in-house often hand the study to a market research firm that uses the same tools.
Can you run conjoint analysis in Excel or R?
Excel can handle a small full-profile conjoint analysis, where participants rate products and you run a regression on the ratings. R can analyze choice-based conjoint analysis data through packages like mlogit and bayesm, but it needs someone comfortable with statistics. Either way, you still need a separate survey tool for data collection.
What are the other types of conjoint analysis?
Menu-based conjoint analysis lets participants build their own product from a list of options, like choosing add-ons for a phone plan. Volumetric conjoint analysis asks how many units participants would buy, which suits products people buy in multiples. Self-explicated conjoint asks participants to rate each attribute directly, with no trade-offs between features.

About the author
Meg Gerli
Research Impact Lead
Meg is a Research Impact Lead at Conveo, working with insights and research teams on the studies they run with Conveo.
Meet Meg on film →Qualitative insights at the speed of your business.
Conveo runs AI-moderated video interviews and structures everything they say.