In this article
TL;DR
When choosing between MaxDiff vs. conjoint, use MaxDiff to rank which features or messages matter most to consumers, and conjoint to find the combination of features and price they'd choose.
If you need both, use MaxDiff to cut a long feature list to the top four or five, then run conjoint on that shortlist.
Both methods show what consumers prefer but not why, and the same top-ranked item can call for different actions depending on the reason. Collecting the reasons in the same study saves insights teams a second qualitative study.
This guide shows insights and CMI teams the key differences between the two analysis methods, so you can choose the one that best answers your research question.
Insights teams choosing between MaxDiff and conjoint are comparing two research methods that look alike on the surface. Both ask survey participants to choose between options, and both measure what consumers prefer.
But picking the wrong one can leave you with results that don't answer the decision you need to make. MaxDiff can't show what consumers would pay for a feature, while using conjoint can be overkill when all you need is a ranking.
This guide explains how to choose between conjoint vs. MaxDiff, and how to capture the reasoning behind the results so your findings lead to a decision.
What MaxDiff and conjoint analysis measure
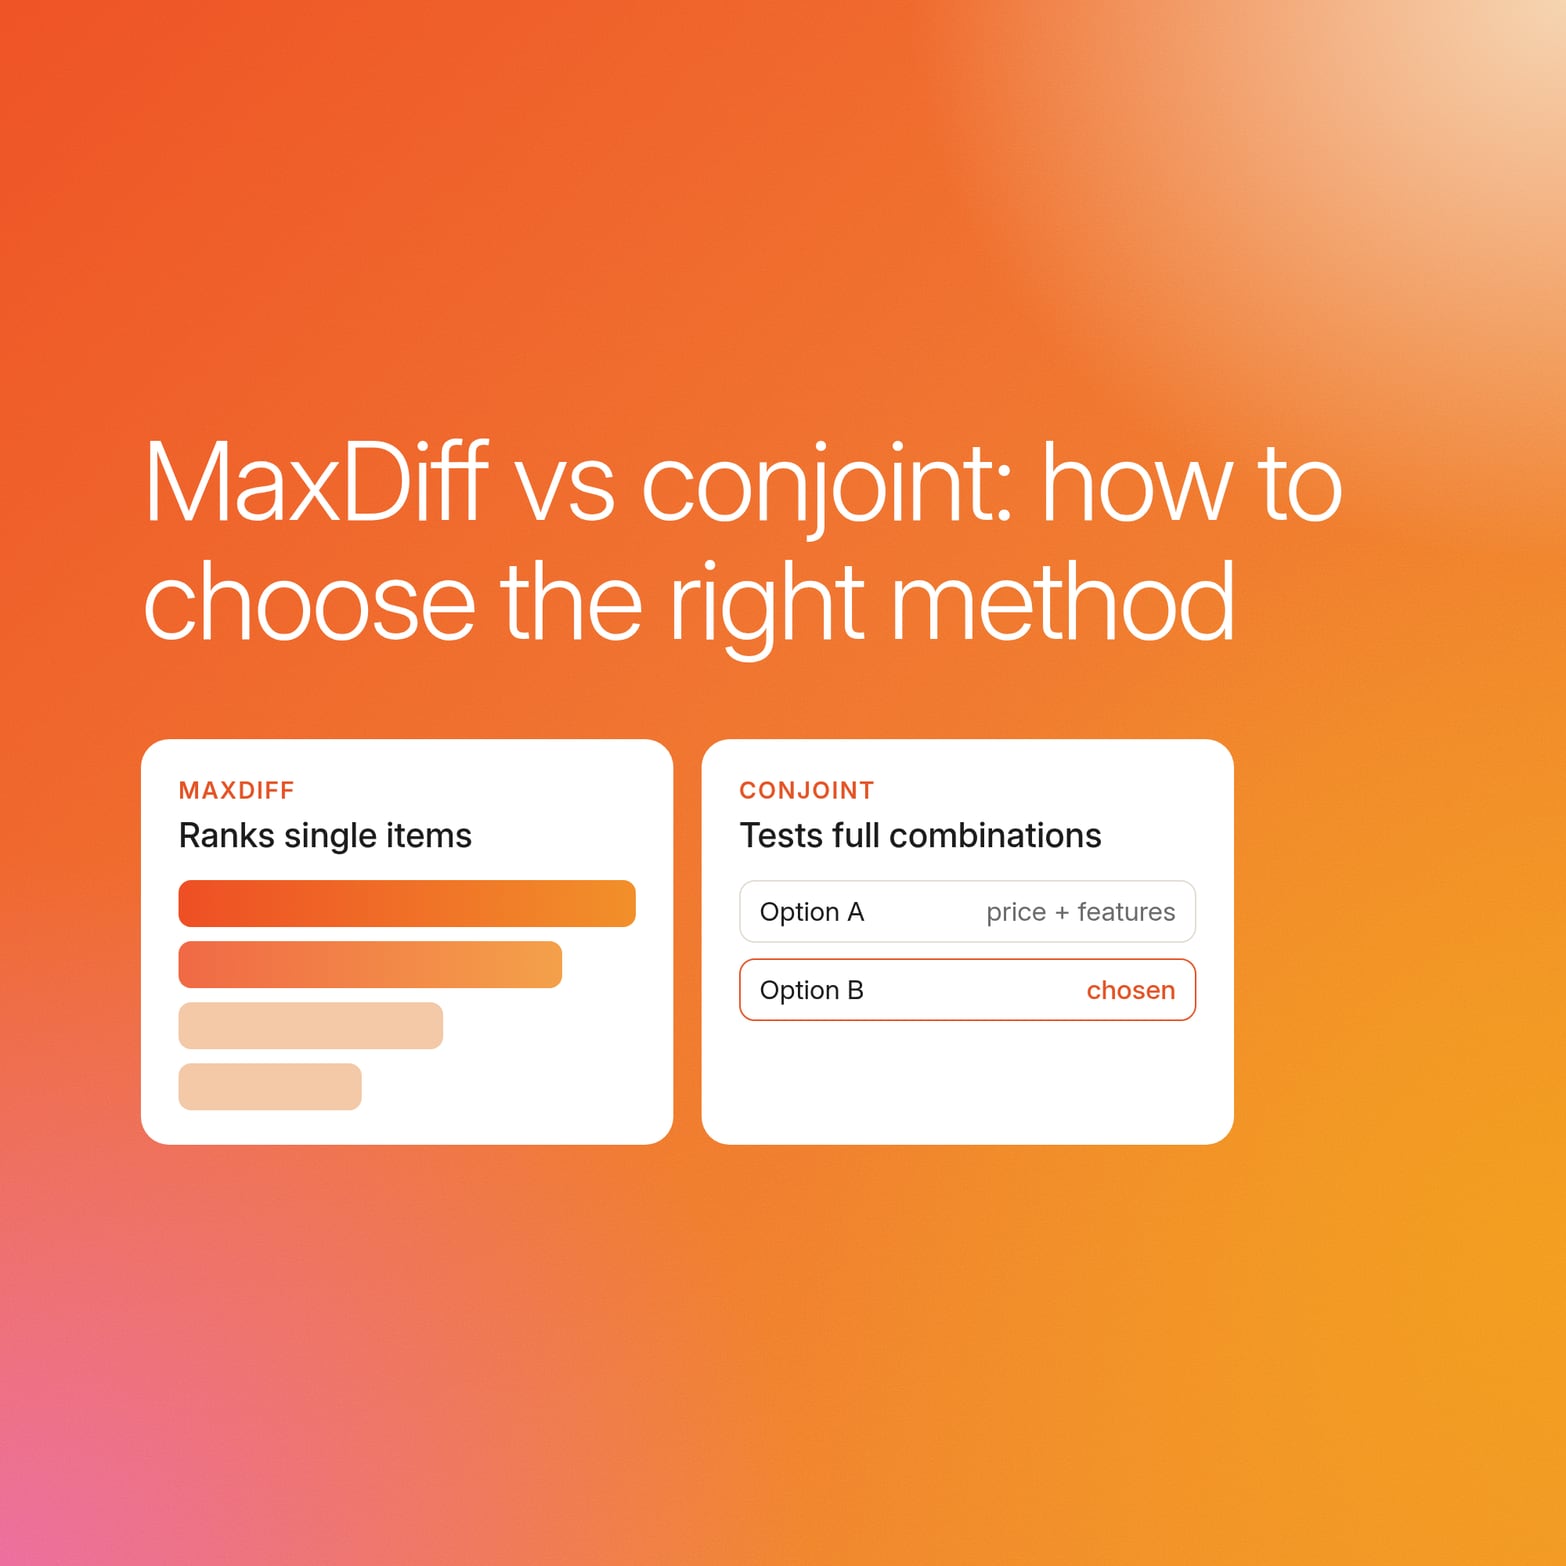
MaxDiff (Maximum Difference Scaling) analysis and conjoint analysis are techniques researchers use to understand consumer preferences by asking them to choose between options. They differ in their approach and the type of preference data they give you:
MaxDiff asks participants to pick the most and least preferred items from small sets of product features, benefits, or messages. Because they have to choose, you get a clear ranking of what matters most.
Conjoint analysis asks participants to choose between complete product or service concepts, each made up of attributes such as price or pack size. This shows how people trade off attributes against each other and lets you simulate which combination they are most likely to choose.
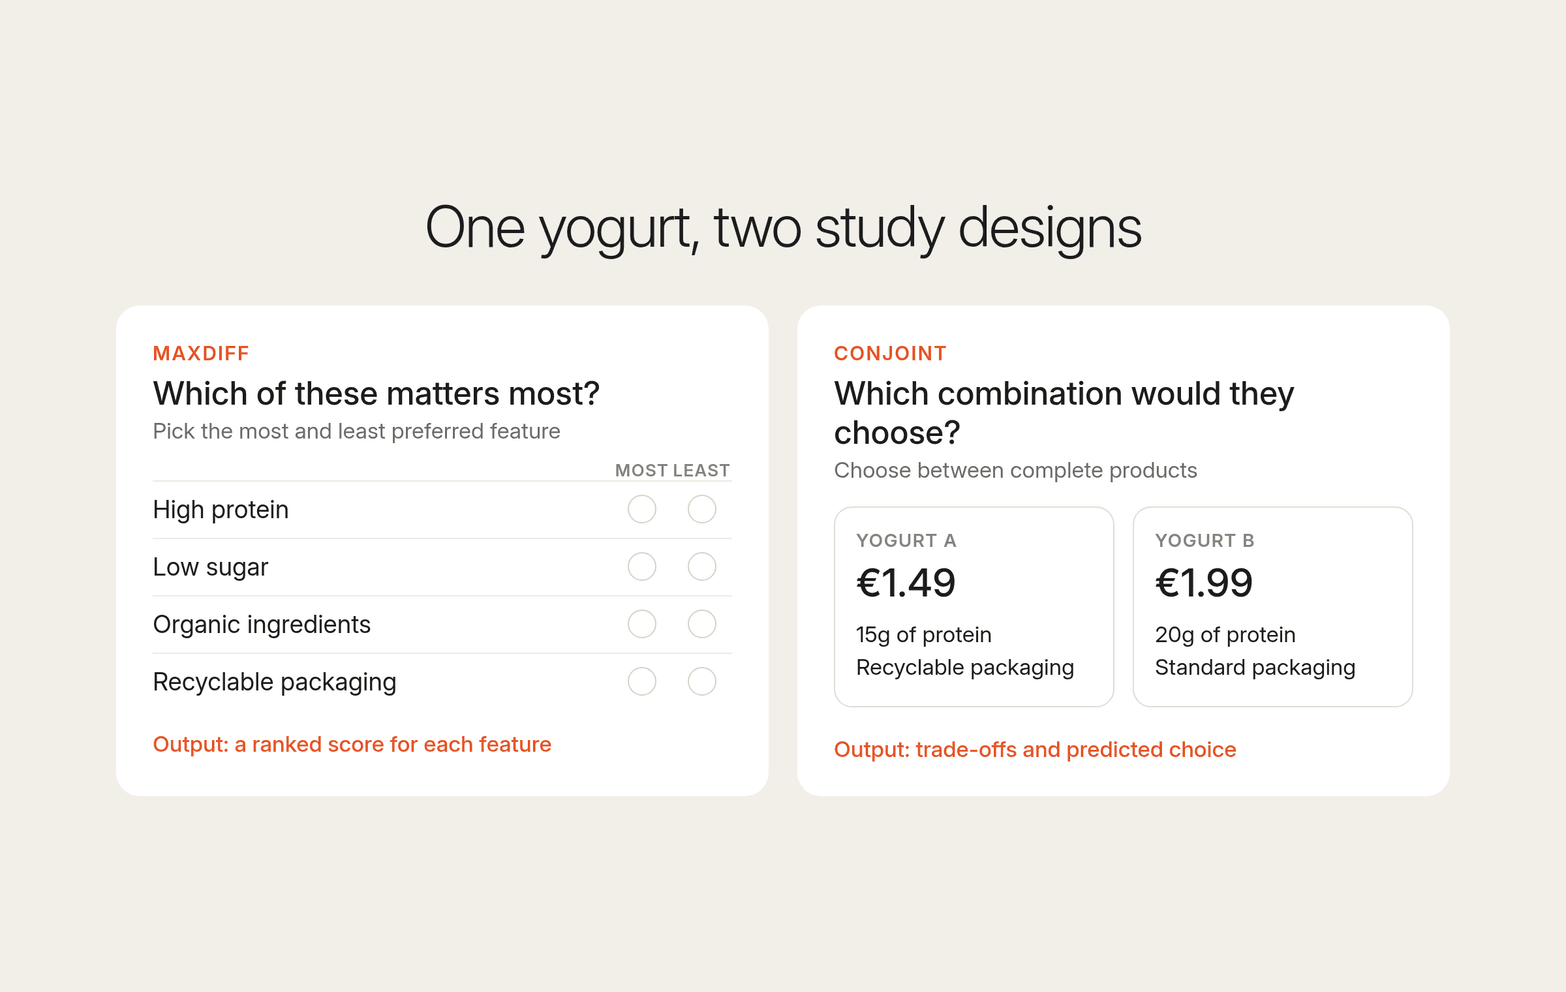
For example, imagine a yogurt brand deciding what consumers want from a new product. MaxDiff might ask them to choose between individual features such as high protein, low sugar, organic ingredients, and recyclable packaging. Conjoint might instead ask them to choose between complete products that combine those features with different prices, such as a €1.49 yogurt with 15g of protein and recyclable packaging versus a €1.99 yogurt with 20g of protein and standard packaging.
When to use MaxDiff analysis vs conjoint analysis
Choosing between MaxDiff and conjoint mainly hinges on the question you want to answer:
Use MaxDiff to answer “Which of these things matter most to our consumer?”
Use conjoint to answer “Which combination would our consumer choose?”
The output you need, and the sample and time you have, also affect the choice:
| Choose MaxDiff if… | Choose conjoint if… | |
|---|---|---|
| Output | A ranked list with a score for each item is enough to decide | You need to see how attributes trade off, or simulate market share |
| Sample | You can recruit around 300 participants, a typical starting point | You can recruit 300 or more, rising with the number of attributes and options tested |
| Time | You need to launch quickly: the study only needs a list of items | You can allow more time for setup and fieldwork: every attribute and option has to be defined first, and each participant completes more tasks |
| Participant effort | You want a short, simple task | Participants can handle comparing full product concepts with several attributes at once |
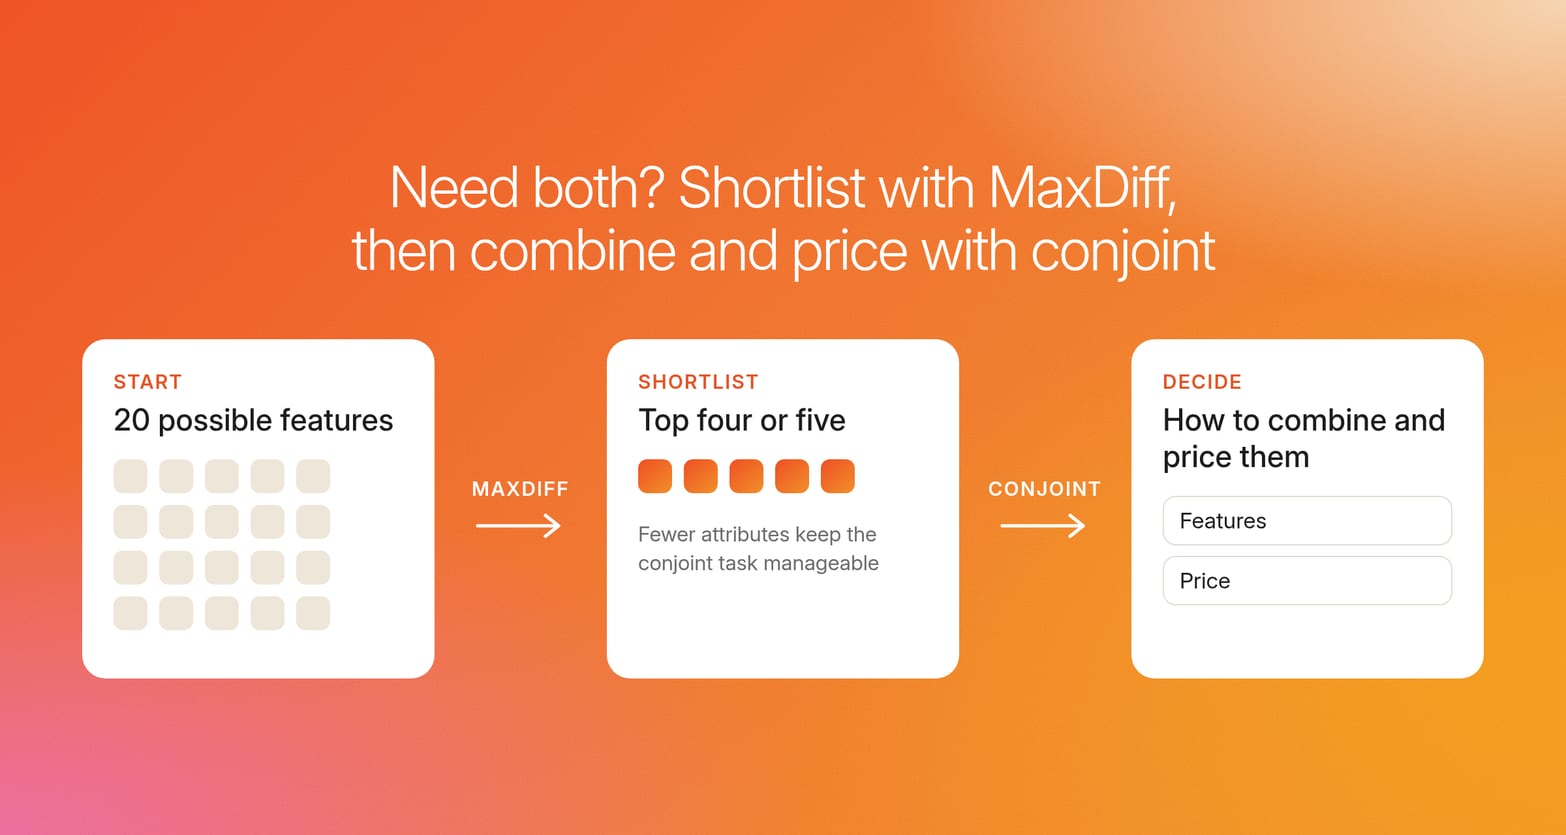
Sometimes, both methods fit. A team with 20 possible features and no set price can use MaxDiff to find the top four or five, then run conjoint on that shortlist to work out how to combine and price them. Conjoint gets harder for participants with each added attribute, so narrowing the list first keeps the study manageable and reduces cognitive load.
Key differences between MaxDiff, ranking, and Kano
Ranking and Kano are also methods for prioritizing features, so they often come up as MaxDiff alternatives. Here’s how MaxDiff compares against them both.
MaxDiff vs ranking
MaxDiff is more useful than a ranking question when you have a longer list and need to decide where to focus. Ranking asks participants to order every item, but with a long list, the middle of the ranking can be less reliable. It also tells you the order without showing how strongly people prefer one item over another.
MaxDiff breaks the list into smaller sets and asks participants to choose the most and least preferred item from each set. The resulting scores show both the order of preference and the size of the differences, giving you more evidence for deciding which items to prioritize.
For example, a pet food brand testing 15 packaging claims might find that “supports healthy digestion” scores far higher than “made with natural ingredients,” while several other claims cluster closely together. It could use that result to lead with the digestion claim and drop the weaker claims from the packaging. With a simple ranking, the brand would know that “supports healthy digestion” came first, but not whether it was a clear favorite or only narrowly ahead of the next claim.
MaxDiff vs Kano
Kano and MaxDiff answer different questions about product features. Kano shows how each feature affects satisfaction, while MaxDiff shows which features consumers prefer relative to one another.
For example, a reusable water bottle brand might use Kano to find that a leak-proof lid is an expected feature: people are dissatisfied if it is missing, but adding it doesn’t make them especially happy. It might also find that a built-in filter is an attractive feature that can increase satisfaction, but people don’t expect it.
That tells the brand what role each feature plays, but not necessarily which feature to prioritize when resources are limited. MaxDiff could compare the filter, insulation, a carrying strap, and a measurement guide and show that insulation is the strongest preference, followed by the filter. The brand could then use that ranking to decide which features to emphasize in the next product version.
What the outputs look like
MaxDiff and conjoint results look very different on the page. Knowing how to read each one helps you judge whether the output will answer your question.
MaxDiff output example
A MaxDiff study gives each item a score (for how those scores are calculated, see MaxDiff utility scores). In the most common format, the scores add up to 100. A higher score means the item was chosen as “best” more often and “worst” less often. Here’s an example showing MaxDiff scores for six oat drink features:
| Feature | Score |
|---|---|
| No added sugar | 26 |
| Foams well in coffee | 23 |
| Made with organic oats | 16 |
| Added calcium and vitamins | 14 |
| Recyclable carton | 12 |
| Locally sourced oats | 9 |
The scores show both the ranking and the size of the differences. “No added sugar” and “foams well in coffee” are close, while both clearly lead the remaining features. That gives the brand a basis for deciding which features to emphasize.
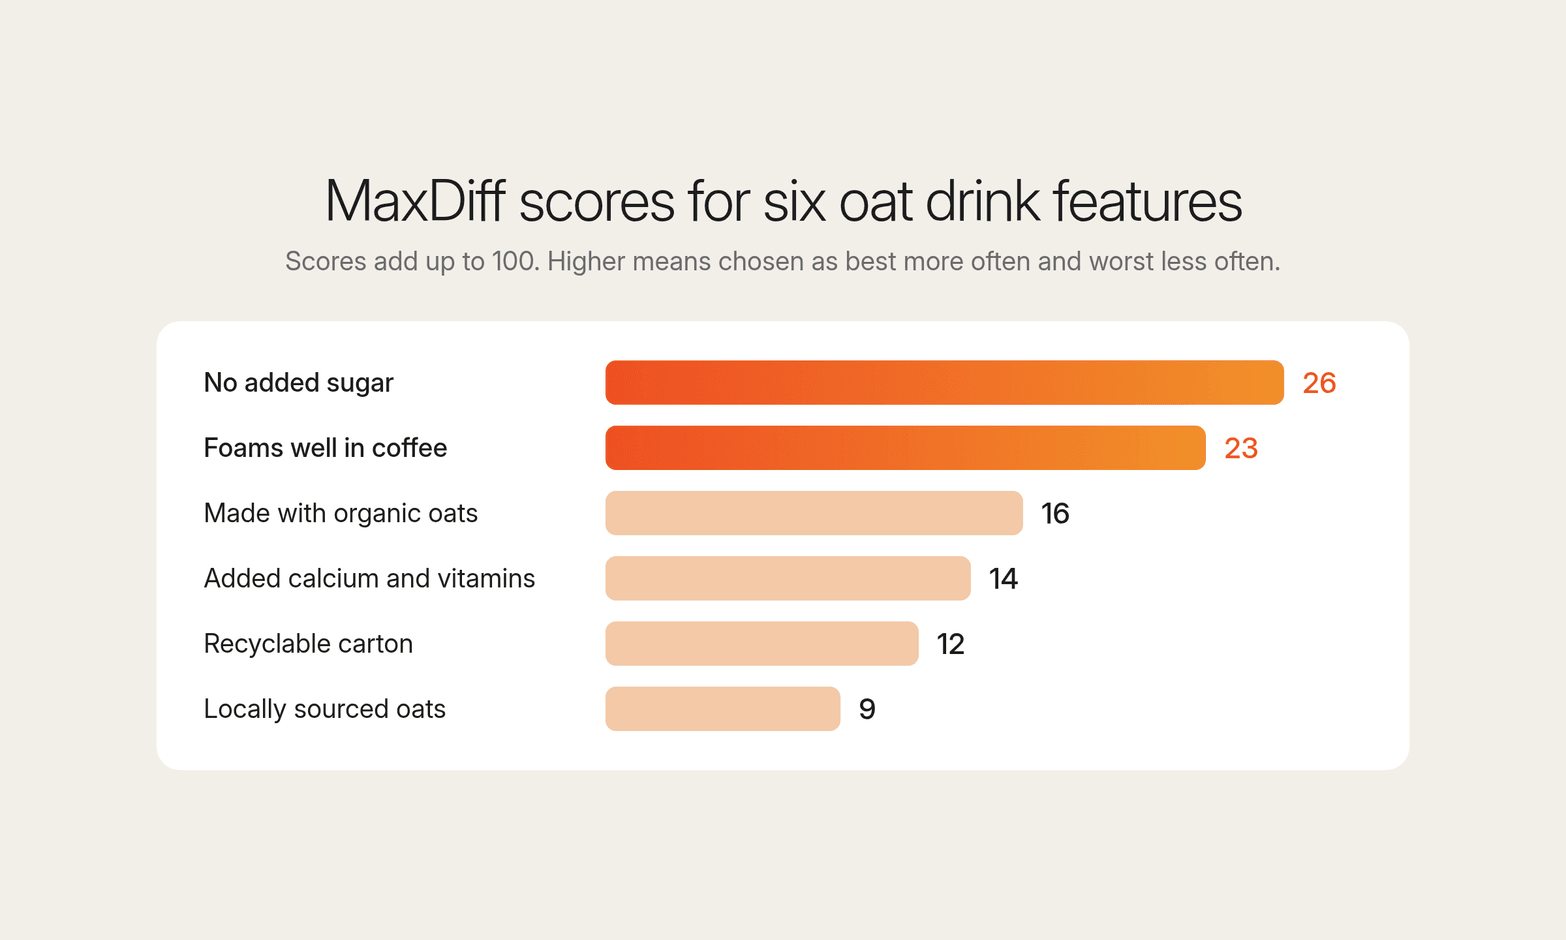
The scores show which features people prefer, but not why. In Conveo, participants can explain their choices on video after completing the MaxDiff tasks. The ranking sits alongside the themes and quotes from those explanations.
Conjoint output example
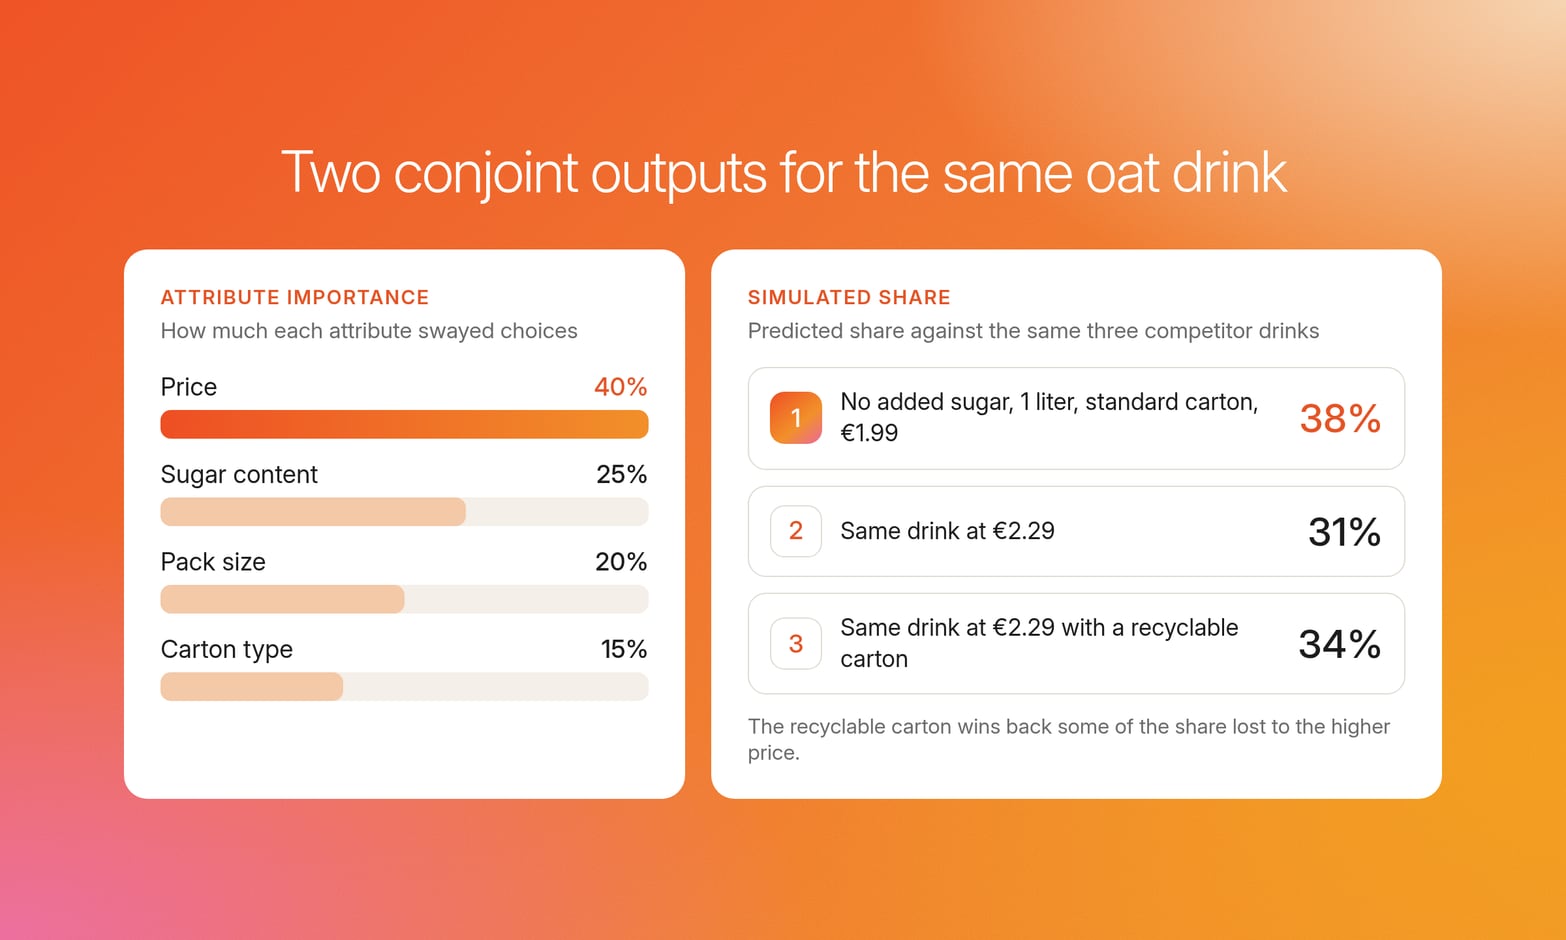
A conjoint analysis study produces two main results. The first is attribute importance. For our oat drink example, participants might choose between complete oat drinks that differ in price, sugar content, pack size, and carton type. The analysis then works out how much each attribute swayed those choices:
| Attribute | Importance |
|---|---|
| Price | 40% |
| Sugar content | 25% |
| Pack size | 20% |
| Carton type | 15% |
The second output is a simulation. From each participant's choices, the analysis estimates how strongly each tested option influences their preference, such as a price of €1.99 versus €2.29 or no added sugar versus regular. It uses those estimates to predict which drink each participant would choose from a line-up of products built from the tested options.
Each simulation tests one version of the brand's drink against the same three competitor drinks, and shows the percentage of participants predicted to choose it. Here are three separate scenarios:
| Scenario | Predicted share against the same three competitor drinks |
|---|---|
| 1. No added sugar, 1 liter, standard carton, €1.99 | 38% |
| 2. Same drink at €2.29 | 31% |
| 3. Same drink at €2.29 with a recyclable carton | 34% |
The results show the recyclable carton wins back some of the participants lost to the higher price.
The "what wins without the why" problem
Standard MaxDiff and conjoint tell you about customer preferences, but on their own, they don’t give you the reasoning behind them. Without that extra context, teams run into problems like these:
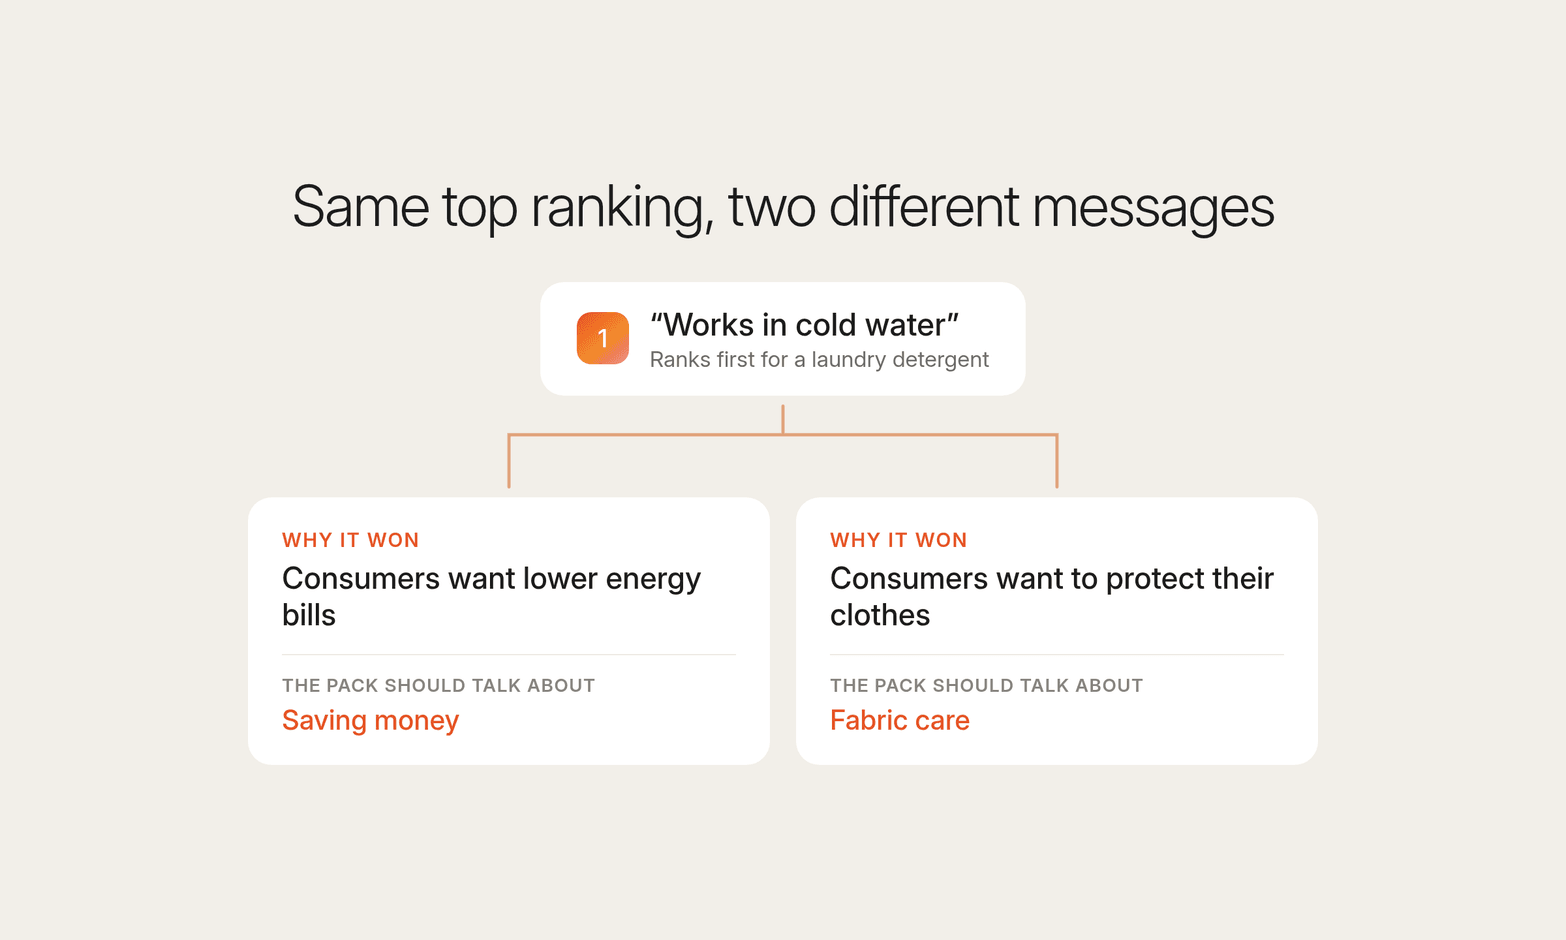
The same result can point to different actions. Say "works in cold water" ranks first for a laundry detergent. If consumers want lower energy bills, the pack should talk about saving money. If they want to protect their clothes, it should talk about fabric care. The ranking is identical in both cases, but the right product message is different.
A low score is hard to read. It can mean consumers don't care about a feature, or that they assume every product already has it. Removing a feature people take for granted can still put them off, so treating a low score as a reason to cut it can lead to the wrong product decision.
Wording problems go unnoticed. A feature can rank low because participants understood it differently from what the team meant. The team may then drop or deprioritize potential features based on a result that doesn't reflect what they intended to test.
Assumptions fill the gap. Product and marketing teams have to work out why an item won and decide what to do with the result. Without participant explanations, those decisions can rest on internal assumptions.
A second study gets commissioned. Getting the reasons afterward means a separate qualitative study, which can add weeks and a second budget while the decision waits.
In Conveo, the MaxDiff task runs inside an AI-moderated video interview. Participants complete the ranking, then the AI research assistant asks why they picked their best and worst items, so the reasons come from the same people in the same session.

Product stage, segment, and stakeholder considerations
The research question should determine the method, but practical limits can rule out an otherwise suitable option. Consider these factors before you forge ahead.
1. How well defined the product is
Conjoint tests specific product combinations, so the team needs to define what it's testing before the study can run. If the product team is still deciding which features belong in the product, it's too early for conjoint. MaxDiff only needs a list of items to prioritize, so it can narrow the options before the product is fully defined.
Using conjoint before the product is defined can mean testing combinations the business would never actually sell, making the results harder to apply to the final product.
2. How many segments need separate results
You need enough participants in each customer segment if you plan to make a separate decision based on that group. For example, a brand comparing consumer preferences across markets needs enough participants in each market to see whether the results differ.
A MaxDiff study with three markets could need at least 200 participants in each, while a conjoint study could need up to 500 in each, depending on the design. If you only need one overall result, you don't need to recruit a full sample for every segment.
If a segment doesn't have enough participants, its results may be too unstable to support a separate decision. The overall sample can look healthy while the segment-level results aren't.
3. What stakeholders will do with the results
Match the method to how the results will be used. A product team choosing which features to include in the next version can work directly from a MaxDiff ranking. A pricing team deciding whether to charge €1.99 or €2.29 needs conjoint to model how the price affects predicted choice.
Conjoint simulations produce modeled estimates, not observed sales. If stakeholders treat those estimates as a sales forecast, they can put more certainty on the result than the research supports. Present the output with enough context for stakeholders to understand what it does and doesn't show.
How Conveo runs MaxDiff with reasoning in one session
A feature or messaging decision made on a MaxDiff ranking alone is made on half the evidence, because the ranking shows what consumers prefer without the reasons behind it. Getting those reasons usually means running a separate qualitative study, then manually matching the two sets of findings.
Conveo collects both in a single study. It's Consumer Understanding Infrastructure: a system that runs AI-moderated video interviews with your target audience and keeps every study in one searchable insight library. A MaxDiff question sits inside the interview, so the ranking and the reasoning come from the same participants. Here's how:
The ranking and the reasons arrive together. Add a MaxDiff question to any Conveo topic guide. Participants complete the ranking as they would in a standard MaxDiff study, then explain their choices on video.
Unclear explanations get a follow-up. Conveo's AI research assistant asks follow-up questions when an answer is vague or leaves a gap, building on what the participant said earlier.
Stakeholders can check where a finding came from. The preference ranking sits alongside the themes and quotes in the analysis. Each theme links to the participants behind it, with video clips and verbatim quotes stakeholders can audit.
Studies meet enterprise security requirements. Conveo is SOC 2 Type II certified, GDPR compliant, with EU hosting in Belgium.
Earlier results stay available for the next decision. Recurring themes and facets are recognized across studies in a searchable insight library, so the next round of feature or message testing starts from what earlier studies established.
"The pace, responsiveness, and research expertise of the Conveo team, on top of the top AI-moderated qual platform, have been invaluable to us in scaling brand advertising internationally."
Matt Harris, Research & Insights Lead, Canva
Frequently asked questions
What is the difference between MaxDiff and conjoint analysis?
MaxDiff asks people to choose the most and least preferred item from a small set. Across multiple sets, the results show which individual features, benefits, or messages people prefer and how far apart those preferences are. Conjoint asks people to choose between complete product concepts made up of multiple attributes. The statistical model shows each attribute's relative importance and how people trade one attribute for another. MaxDiff suits feature prioritization, while conjoint suits decisions about complete product offerings.
When should I use MaxDiff instead of conjoint?
Use MaxDiff when your research objective is to prioritize individual items, and you need a clear ranking. It can help a product team determine which features matter most when deciding what to focus on. Use conjoint when the decision involves several product attributes together. For example, if you're deciding how price and pack size should work together in a new product, conjoint can show how consumers respond to those trade-offs and how different product combinations affect choice.
Can I run MaxDiff and conjoint in the same study?
Yes, if your research objectives require both methods. MaxDiff can establish which individual features or benefits people prefer, while conjoint can show how those features affect choices when they appear together in a complete product. Running both adds more tasks to the study, which increases participant effort and can extend the timeline. Whether that makes sense depends on the decisions the research needs to support.
How many participants do I need for MaxDiff?
A common starting point is around 300 participants per study, with at least 200 in each group you want to analyze separately, but no single sample size works for every study. The number you need depends partly on how many items you're testing and whether you need to analyze different groups separately. The aim is to collect enough data for the scores to remain stable and useful for the decision you're making.
How long does a MaxDiff study take?
A MaxDiff study is usually quicker to set up than conjoint, because it only needs a list of items. Conjoint requires defining every attribute and option before launch, and each participant completes more tasks. For either method, the overall timeline mostly depends on recruitment. A hard-to-reach audience or several segments takes longer to fill.
How do I interpret MaxDiff scores?
A MaxDiff score shows how strongly an item is preferred relative to the other items in the study. Higher scores indicate stronger preference, while the gap between scores shows how far apart items are. For example, scores of 26 and 24 suggest two items are close in preference, while scores of 26 and 10 show a much larger difference. When several scores cluster together, that can indicate a natural preference tier. However, the scores are quantitative data. They tell you what people prefer, but they don't explain why they made those choices.

About the author
Hendrik Van Hove
Founder & CPO
Hendrik is Conveo’s Chief Product Officer and co-founder. He's extremely passionate about technology and the real positive impact it can bring. Before Conveo, he ran AI strategy projects at McKinsey for the Fortune 2000, working with boards and every function from marketing, to sales to insights.
More by Hendrik →Qualitative insights at the speed of your business.
Conveo runs AI-moderated video interviews and structures everything they say.