


TL;DR
Qualitative and quantitative measurements differ in both the type of data they involve and how they are analyzed. Quantitative work produces numbers, while qualitative work turns interviews and open-ended answers into structured findings.
Qualitative measurement often breaks down when feedback is converted into structured insights without a clear, repeatable analysis process, making findings difficult to validate or compare.
A good framework for qualitative measurement includes clear operational definitions, a labeling guide, alignment between researchers, and documented decision-making throughout the analysis process.
With the right framework in place, teams can produce traceable, evidence-backed qualitative measures and reporting in days rather than weeks.
Qualitative research generates rich data, but turning it into findings that stakeholders will act on is harder than it looks. Most teams can run interviews and focus groups. Fewer have a consistent process for tracing and labeling what they find in a way that holds up under scrutiny.
This article explains what qualitative research measures are and how they differ from simply collecting qualitative data, with a five-step framework that enterprise teams can use to make findings traceable and defensible.
What Is Qualitative Measurement?
With more research methods easily accessible and AI to help speed up the process, enterprise teams are generating more qualitative data than ever. The challenge is how to consistently analyze these large volumes of data.
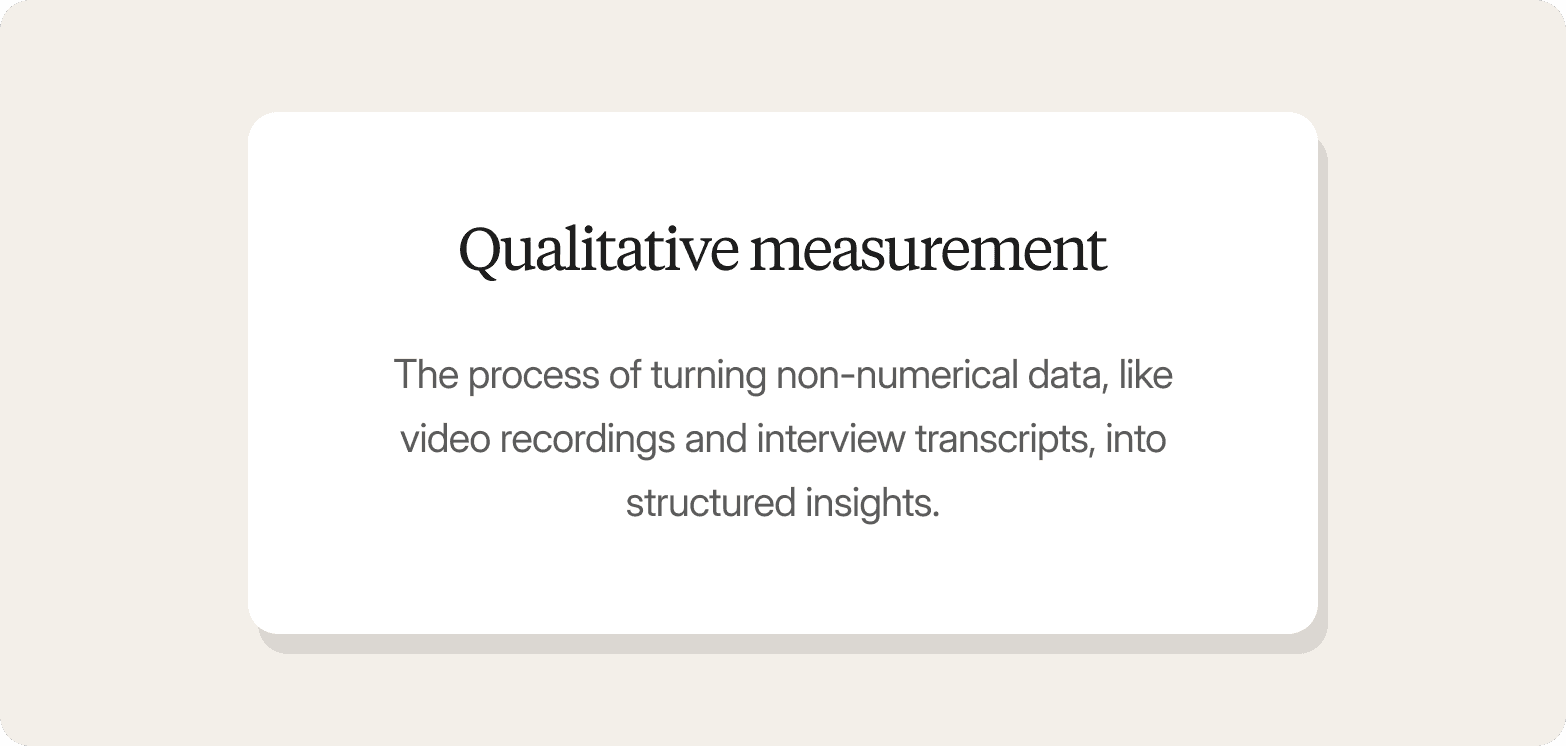
Qualitative measurement is the process of turning non-numerical data, like video recordings and interview transcripts, into structured insights. It’s different from quantitative measurement, which focuses on numerical data and statistical analysis. Here are the differences in more detail:
Dimension | Qualitative | Quantitative |
Data type | Qualitative measurement works with narrative, visual, and behavioral data. | Quantitative measurement applies to both numerical and categorical data. |
Collection methods | Qualitative data is collected through interviews, observation, open-ended survey questions, diary studies, and focus groups. | Quantitative data is collected through surveys and analytics platforms. |
Analysis approach | Qualitative analysis focuses on labeling responses and identifying patterns across participants. | Quantitative analysis uses statistical methods to identify trends and relationships in data. |
Enterprise use cases | Qualitative measurement is used for concept testing, discovery research, and messaging validation. | Quantitative measurement is used for market sizing, conversion tracking, and A/B testing. |
Qualitative and quantitative research methods both have their place in enterprise research programs. What’s important is that qualitative findings meet the same standard of rigor as the quantitative metrics they sit alongside.
Why Qualitative Measurement Matters for Enterprise Teams
Qualitative research informs some of the highest-stakes decisions enterprise teams make, from pricing and positioning to creative testing and product adoption. But it’s only useful when it’s measured in a way that can withstand scrutiny. Here’s why:
Without a traceable chain of evidence, qualitative findings are treated as context rather than proof. Stakeholders often default to quantitative data because it is easier to defend, even when it doesn’t explain the behavior behind the numbers.
Enterprise governance raises the bar further. When research informs product or pricing decisions, teams need to show how responses were interpreted, which framework was used, and where the source data is stored.
Qualitative measurement provides that structure. It creates a consistent way to label responses, track decisions, and present findings so they can withstand the same level of scrutiny as quantitative data.
"Conveo gives us quant-level robustness and qual-style depth."
- CMI Lead, Edgard & Cooper
5 Common Qualitative Measurement Methods
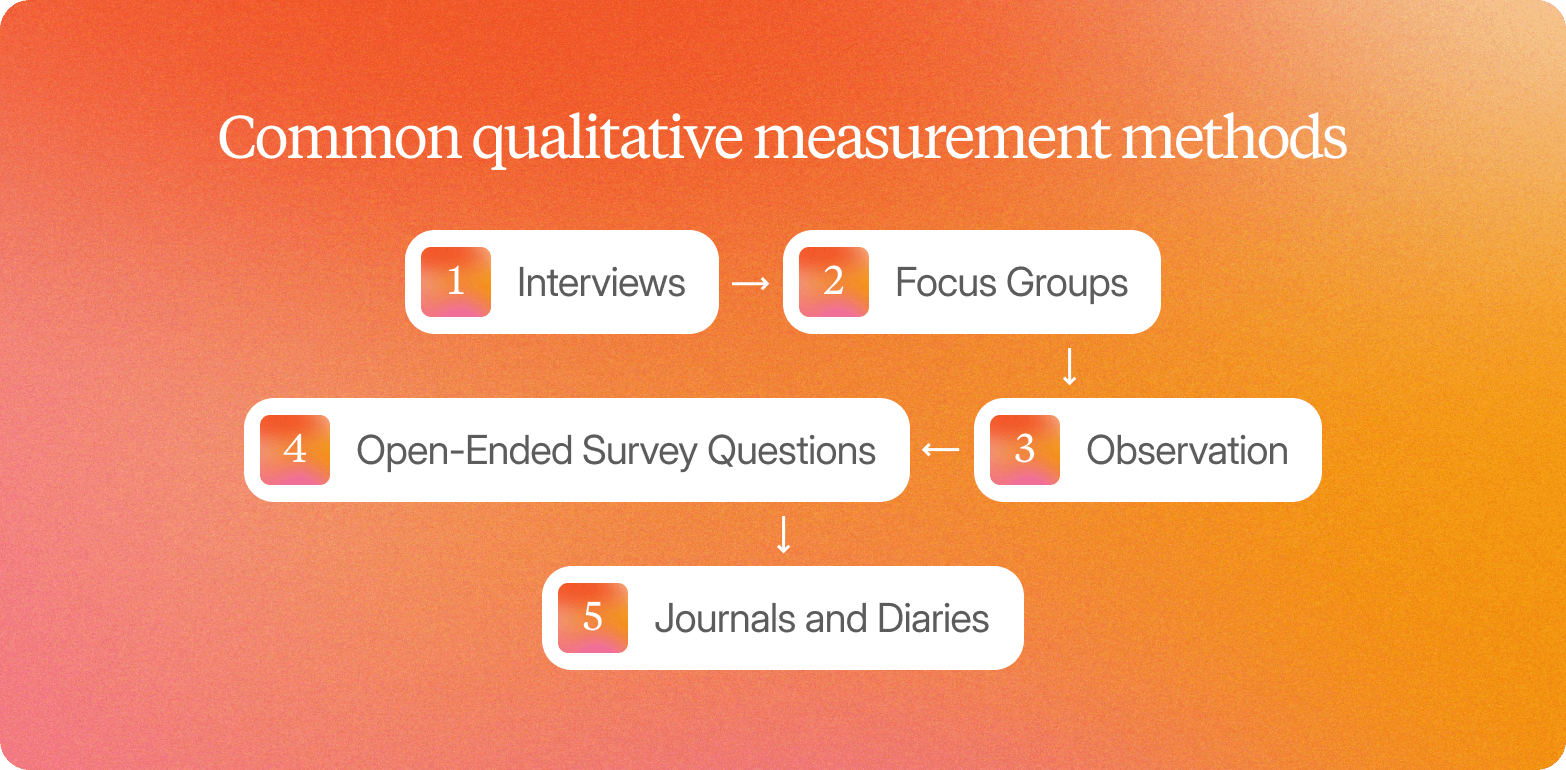
Each qualitative method captures a different type of data and requires its own approach to consistently labeling and tracing findings. Here are some of the most common methods and how to measure them.
Interviews
One-on-one interviews generate transcript and video data from individual conversations. The most common interview measurement techniques are thematic analysis, which tracks which themes appear across participants, and frequency counting, which shows how often a specific signal appears across the dataset. Researchers can tag tone and expression from video as additional signals alongside what participants said.
At enterprise scale, scheduling interviews across markets creates a coordination problem. Conveo, a video-first AI research platform, enables teams to run async AI-moderated interviews in parallel, so data collection scales without scheduling bottlenecks.
Focus Groups
Focus groups generate discussion data from multiple participants in the same session, making them well-suited to consensus tracking and sentiment measurement. Moderation is more complex than a one-on-one interview because the moderator must manage group dynamics while capturing individual responses.
Observation
Observation generates behavioral data captured in context. The main measurement technique is behavioral frequency counting: identifying specific actions, such as hesitation or a workaround, and tracking how often they occur across sessions. Video recordings extend this by making tone, expression, and environmental context available for measurement alongside actions.
Open-Ended Survey Questions
Open-ended survey questions generate written responses at scale. Thematic and sentiment analyses are the most common measurement techniques, identifying which concerns or reactions appear most often and how they are distributed across segments. The challenge at volume is consistency: without a labeling framework, responses are hard to compare across participants or use as structured evidence.
Journals and Diaries
Diary studies generate entries collected over time, making them suited to longitudinal pattern analysis: tracking how themes or attitudes shift across entries rather than measuring a single point in time. The operational challenge is synthesis. Entries accumulate across participants and time points, and manually pulling them into coherent findings is time-consuming.
How to Measure Qualitative Data: An Enterprise-Grade Framework
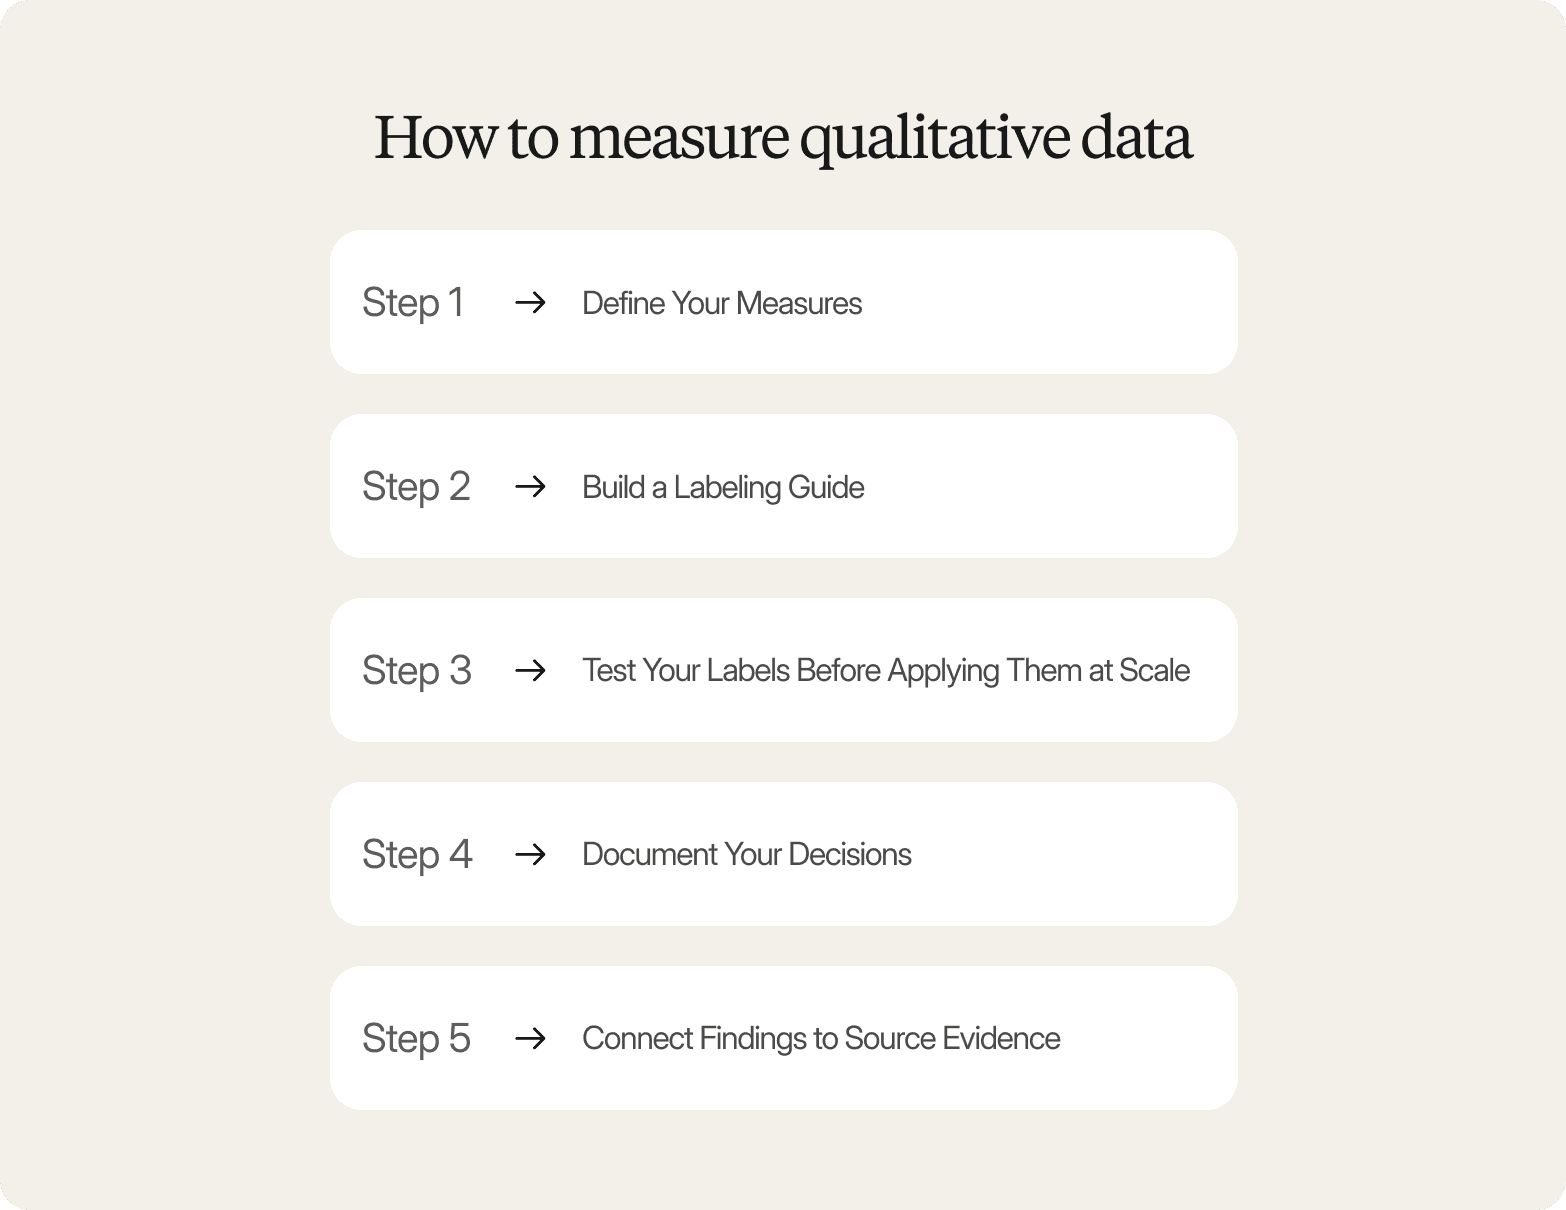
Raw qualitative data doesn't become a finding on its own. Someone has to decide how to label it, and how to apply that label consistently across hundreds of responses. These five steps cover that process.
Step 1. Define Your Measures
Before anyone starts reviewing responses, the team needs to agree on what they're looking for. That means writing a precise definition for each concept the research is trying to capture. If the goal is to measure "confusion," the team needs to agree on what that means: hesitation, clarifying questions, or some combination of both.
Without those definitions, two researchers will look at the same clip and reach different conclusions. That inconsistency makes findings hard to defend, because there's no way to show that everyone applied the same standard.
Step 2. Build a Labeling Guide
Once you have definitions for each concept you're measuring, you need a way for researchers to apply them consistently across large volumes of responses. A labeling guide does that: it assigns a short label to each concept, explains what it means, and gives examples of responses that do and don't qualify.
For enterprise teams, it also serves a governance function: if a finding is later questioned, the guide shows exactly which standard was applied.
Step 3. Test Your Labels Before Applying Them at Scale
Before labeling the full dataset, have two or more researchers independently label the same small sample, then compare results. Where they disagree, the labeling guide needs to be clearer. This step addresses a question that arises in stakeholder reviews: would someone else have reached the same conclusion?
Step 4. Document Your Decisions
Keep a record of every decision made during analysis, such as why a label was applied in an ambiguous case or why a label definition was updated. This creates an audit trail that connects every valuable data finding to the process that produced it. When a stakeholder asks how a finding was reached, the decision log provides a direct answer.
Step 5. Connect Findings to Source Evidence
When presenting qualitative insights, include the quotes, clips, and timestamps that support them so stakeholders can check the source themselves rather than relying on a summary. This matters particularly when AI tools assist with analysis. Linking each finding to its source evidence shows that the output reflects what participants really said.
Measuring Beyond Text: Multimodal Qualitative Signals
Most enterprise teams apply this framework to text data such as interview transcripts and survey responses, but video provides information that text alone misses.
A pause before answering a question about pricing can suggest uncertainty that doesn’t show up in a transcript. A change in tone when describing a feature someone says they like can also point to a concern they haven’t clearly stated.
Researchers can still treat these signals as measurable observations by marking moments of hesitation, confidence, or uncertainty and tracking how often they appear.
For stakeholders, video is easier to trust because they can see the moment firsthand rather than relying on interpretation. It also strengthens documentation, since the original recording becomes part of the evidence trail.
"Conveo's video-first approach is a real differentiating methodological advantage. The ability to distill insights from reactions and not just hear answers adds context you simply can't get from transcript-only tools, or any other tool in the market for that matter."
- Senior Marketing Research & Insights Manager, Google
Qualitative Measurement in Practice: CMI, Brand, and Product Workflows
The five-step framework applies across research scenarios, but the labels and reporting formats change based on what a team is trying to learn. These four workflows show how that plays out across some common study types.
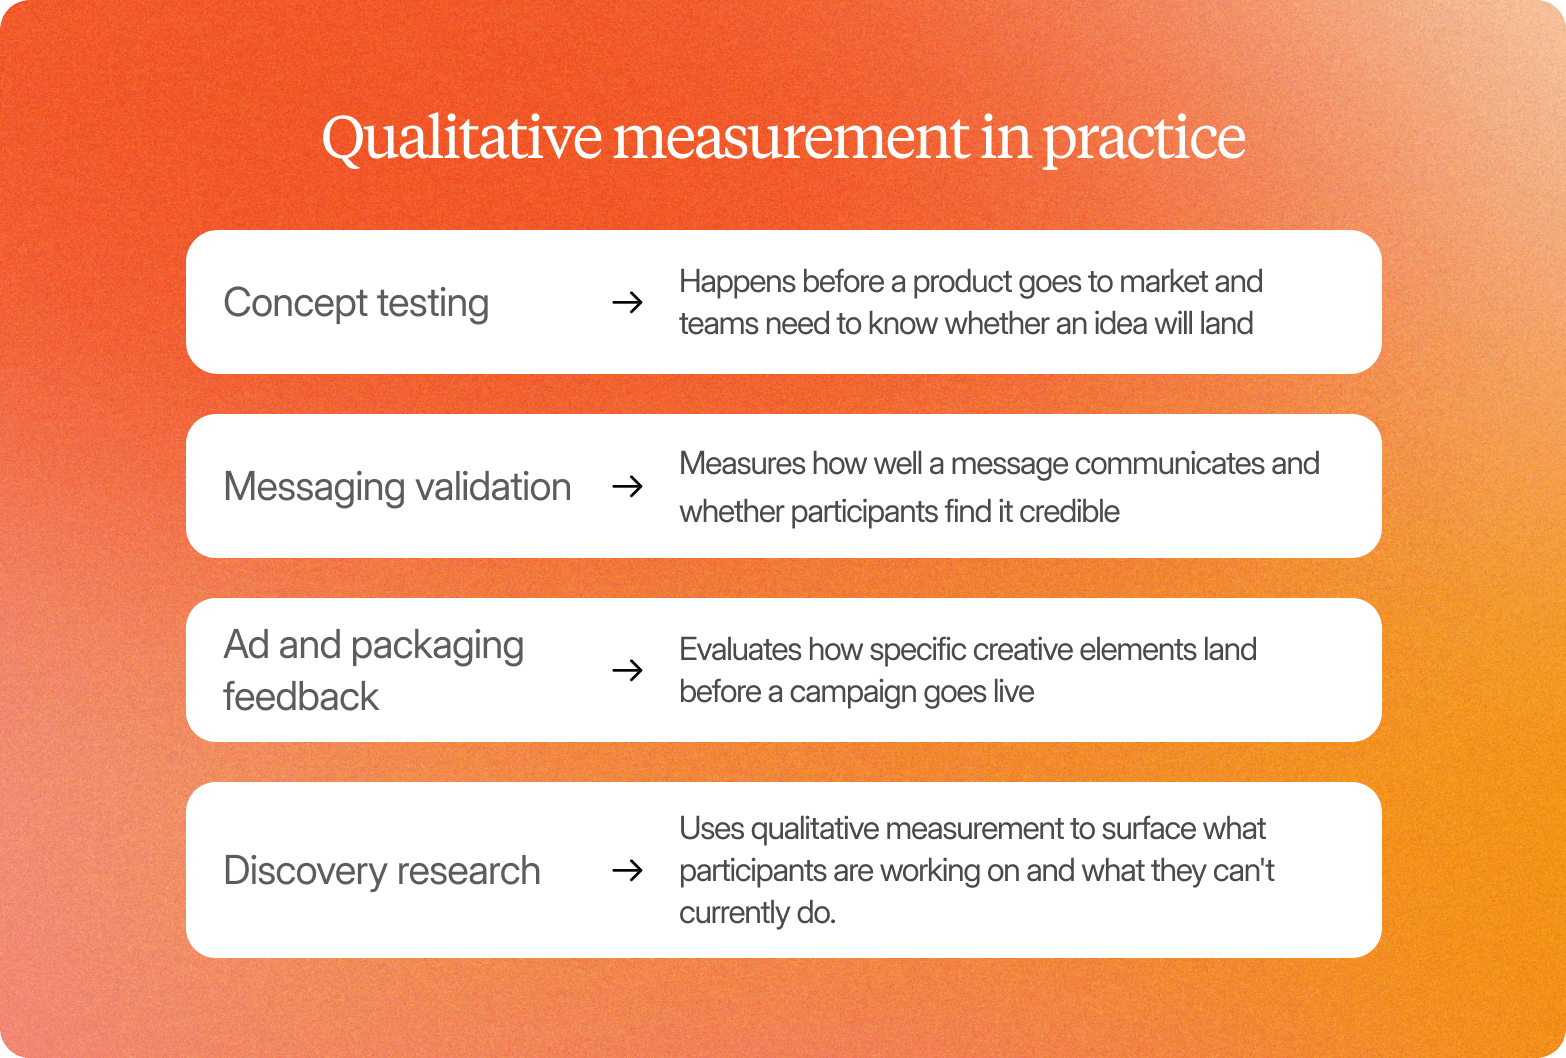
Concept Testing
Concept testing typically happens before a product or campaign goes to market, when teams need to know whether an idea will land and where it falls short. The main measurement units are what attract people and what put them off. Confusing parts of the concept are tracked separately to show where the idea is unclear.
For example, a product team testing a new subscription tier might find that most participants responded positively to the feature set but consistently hesitated when pricing was introduced. With confusion labeled at that specific point across eight of twelve participants, the team has a clear, defensible finding to act on before launch.
Messaging Validation
Messaging validation measures how well a message communicates and whether participants find it credible. Researchers also track emotional response, noting where tone or language created a strong reaction.
For example, a financial services team wanting to validate a new campaign headline might find that participants understood the message but expressed skepticism at a specific claim. With credibility labeled as low at that point and video clips attached, stakeholders can watch the reaction themselves rather than taking the researcher's word for it.
Ad and Packaging Feedback
Ad and packaging market research evaluates how specific creative elements land before a campaign goes live. Structuring the labeling guide around individual elements means researchers can report findings element by element.
For example, a food brand testing new packaging might find that participants consistently missed the primary health claim because their attention went to the imagery first. That finding gives the creative team a specific brief: the claim needs to move, not the design.
Discovery Research
Discovery research uses qualitative measurement to surface what participants are working on and what they can't currently do. Researchers label specific moments and barriers as they appear, tracking how often each comes up across participants.
For example, a SaaS team running discovery research might find that participants across multiple segments describe manually exporting data as a regular workaround for a missing integration. A barrier that consistently occurs across contexts is harder to deprioritize than one that arose only once.
Each of these study types requires a different measurement setup before data collection begins. The Measurement Design Worksheet helps you define measures, build your labeling guide, and structure your reporting format for any of the workflows above.
Choosing the Right Measurement Approach: Decision Guidance
Three factors most commonly determine which approach to qualitative measurements fits a given study. Work through each before choosing a platform or method.
Timeline and Capacity Constraints
If a study needs to influence a decision that's already in motion, the priority is compressing the time between data collection and findings. Async AI-moderated interviews remove scheduling as a bottleneck by running conversations in parallel, reducing what is typically a six-week process to three days.
For lean teams supporting large organizations, automated transcription and AI-assisted labeling reduce the manual work between collection and analysis. A small team can run studies at a scale that would otherwise require significantly more headcount.
Markets, Languages, and Stakeholder Credibility
If research needs to run across multiple markets, prioritize platforms that support AI moderation in 50+ languages with recruitment across 50+ markets. That removes the need to manage separate vendors for each region and keeps the measurement framework consistent across all markets.
If stakeholders distrust findings from qualitative studies, prioritize traceability. The audit trail and evidence linking covered in steps four and five of the framework address this directly: when stakeholders can review the source clip or quote behind a finding, it carries more weight than a summary alone.
Vendor Evaluation Checklist
Once you know which factors apply, use this checklist to evaluate platforms:
Is the platform SOC 2 certified?
Is it GDPR compliant, and can customers choose where their data is hosted?
Does it support SSO and enterprise access controls?
Does it cover the full workflow from recruitment through reporting?
Can stakeholders trace a finding back to the source video and transcript?
Does it support labeling consistency checks across multiple researchers?
Does it use only real participants, with no synthetic respondents?
Compliance data reflects publicly available information as of June 2026. Verify directly with vendors.
For enterprise teams evaluating qualitative measurement platforms, Conveo delivers traceable research with SOC 2 certified compliance and full workflow coverage. Book a demo or request a security overview.
Challenges and How to Address Them
Applying a measurement framework at enterprise scale introduces a few common operational challenges. These are the three most common issues and how to address them.
Getting Qualitative Findings to Stakeholders Before Decisions Are Made
The most common reason qualitative findings arrive too late is manual synthesis. When researchers spend weeks working through transcripts and organizing key themes by hand, findings often reach stakeholders after the decision has already been made.
Automated transcription and AI-assisted labeling remove those manual steps. The key is maintaining traceability as speed increases: steps four and five of the framework ensure every finding still links back to the source evidence, even when the analysis runs in days rather than weeks.
Watch: How to build and launch a study in Conveo→
Making Qualitative Measurement Replicable Across Researchers
The most common objection to qualitative measurement is that two researchers will always reach different conclusions from the same data. Operational definitions and a labeling guide address this directly. When every label has a precise definition and examples of how to apply it, a second researcher working from the same guide should reach the same conclusions.
Labeling consistency checks take this further. Having multiple researchers label the same sample independently and compare results surfaces gaps in the labeling guide before they affect the full dataset. That process makes the analysis auditable in a way that satisfies governance requirements.
Maintaining Measurement Consistency Across a Fragmented Toolstack
When each stage of the research process sits on a different platform, data moves between systems at every step. That creates inconsistencies in how findings are tracked and makes it harder to maintain the audit trail required by steps four and five of the framework. End-to-end research platforms address this by keeping the full workflow in one place.
For enterprise teams, compliance should be built into the platform infrastructure rather than handled manually, and research should use real participants rather than synthetic respondents. It's also worth evaluating whether findings accumulate in a searchable library over time: when previous research is searchable, new studies build on it rather than starting from scratch.
How Conveo Delivers Traceable Qualitative Measurement
The framework covered in this article works only if the platform supports each step, from defining measures to linking findings to source evidence. Conveo is built around that chain of evidence, covering the full research workflow from data collection through to stakeholder-ready reporting.
Every finding links back to the source video and transcript, so stakeholders can verify the mechanism behind a finding rather than relying on a summary.
Tone, hesitation, and expression are captured alongside the transcript, giving researchers more signal when defining and applying measures. Qualitative measurement captures more than what participants said.
Interviews run in parallel across 50+ languages, compressing the time it takes to collect data from weeks to days. The analysis that typically takes six weeks runs in three days, keeping the depth of individual conversations intact.
Findings accumulate across studies in a searchable library, so new research builds on what the team already knows rather than starting from scratch. For large teams, that consistency reduces ramp-up time and keeps findings comparable across waves.
Conveo is SOC 2-certified and GDPR-compliant, with customers choosing where their data is hosted. Compliance is built into the platform infrastructure, not handled separately by each team.
Frequently Asked Questions
What is a qualitative measurement example?
How do you measure qualitative data?
What is the difference between qualitative and quantitative measurements?
What are qualitative measurement methods?
How do you ensure qualitative measurement is reliable?
What tools are used for qualitative measurement in enterprise research?


