In this article
TL;DR
The measurement gap is real: Analytics platforms tell you where shoppers drop off in the ecommerce customer journey but rarely why. Cart abandonment rates, funnel drop-offs, and session recordings show the symptom; the motivation behind customer behavior stays invisible, and by the time a debrief surfaces it, the decision has often already shipped.
Evidence-based journey validation closes the gap: Combining behavioral data with AI-moderated interviews surfaces the reasoning behind observed patterns, so teams can confirm which journey stage is broken and identify the pain points causing it while the decision is still open, before committing to a fix.
Fix the root cause: Without the "why," optimization efforts address the surface: teams redesign checkout flows when the issue is trust at the product page, or discount when it's unclear value communication.
Who this is for: Insights, CMI, and brand teams, alongside marketing teams, customer success, and support teams at ecommerce businesses who have behavioral data but lack the customer's perspective to act with confidence.
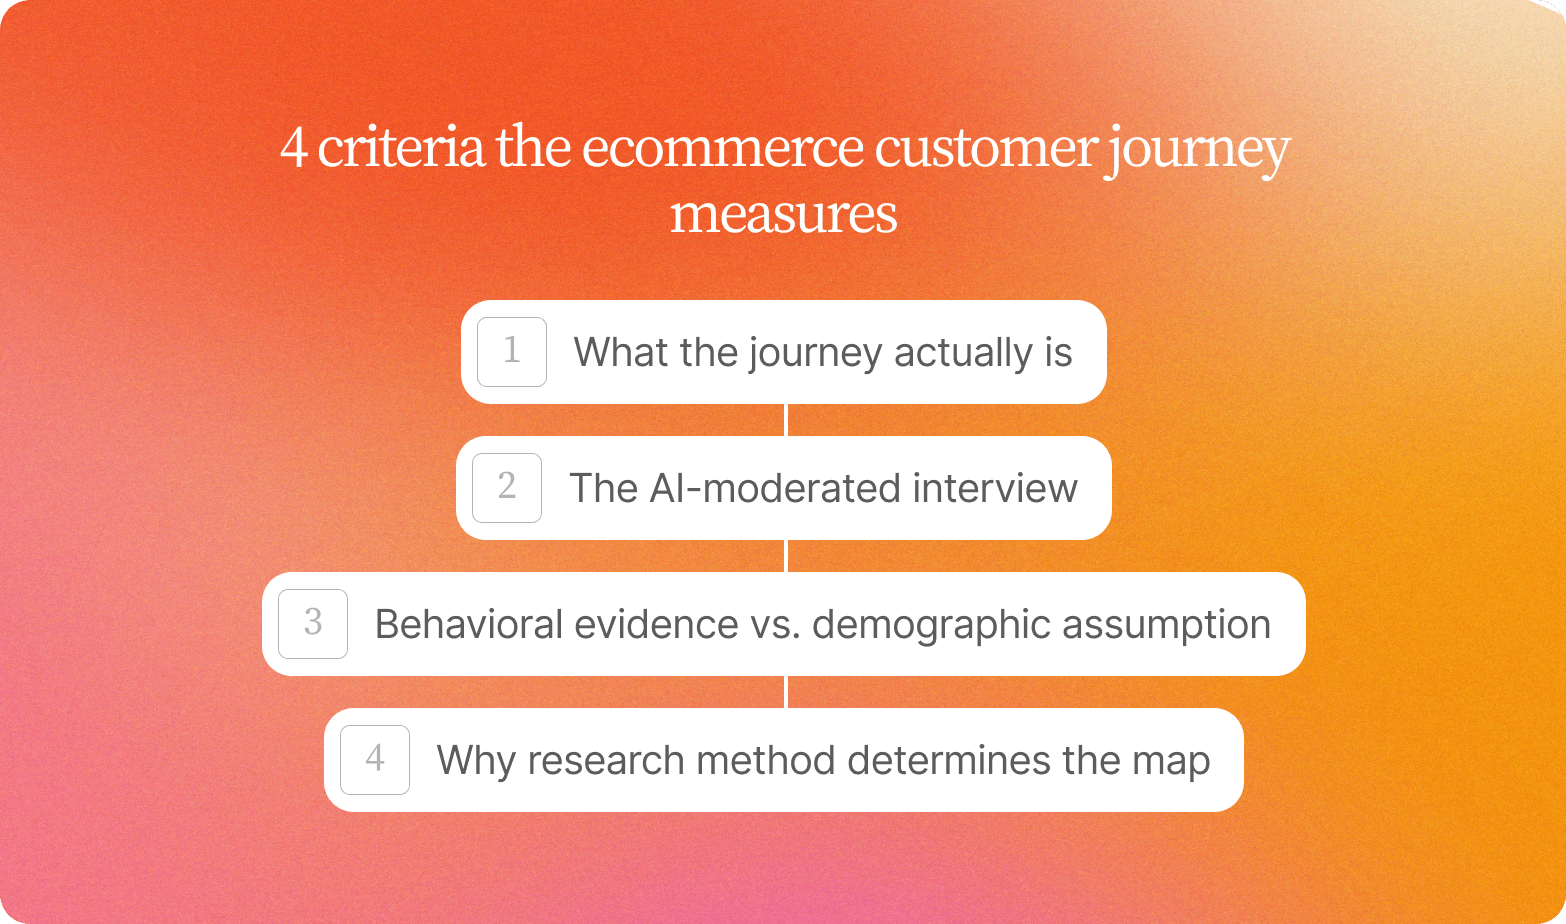
4 criteria the ecommerce customer journey actually measures
Understanding why the customer journey is important starts with recognizing what it actually is: the lived sequence of moments where a shopper decides whether to keep going or leave, rather than a marketing abstraction.
1. What the journey actually is
The ecommerce customer journey is the sequence of decisions and customer touchpoints a shopper moves through during the buying process, from initial awareness to post-purchase behavior: how they discover a product, what triggers consideration, where doubt enters and resolves, and whether they return, renew, or move through an onboarding process into the customer lifecycle's next stage.
That sequence isn't the same as a traffic funnel of pageviews and click-through rates. Whether customers interact with a brand through search engines or a recommendation, the same gap applies: none of it tells you, from the customer's perspective, why shoppers hesitated or what soured the experience after the parcel arrived.
2. The AI-moderated interview, defined
An AI-moderated interview is a structured qualitative conversation where an AI research assistant follows a researcher-defined guide and probes for the reasoning behind a participant's answers, without a human moderator present, gathering customer feedback and collecting data teams can act on directly.
3. Behavioral evidence vs. demographic assumption
The distinction that matters most for research purposes is between behavioral evidence and demographic assumption:
Demographic profiles tell you who your customer is on paper.
Behavioral evidence tells you what actually drove the decision, reflecting customer behavior as it happens rather than a static profile assigned in advance.
A 34-year-old urban professional and a 52-year-old suburban parent can exhibit identical purchase behavior for different reasons, and a map that reduces both to a single typical customer profile will misread what's driving each. Behavioral evidence comes from what participants describe in their own words: the comparison before adding to cart, the review that tipped them, the pain points that almost made them leave.
4. Why the research method determines the map
Research method determines what journey mapping measures. A map built from workshop consensus reflects what the internal team believes about customer needs rather than what shoppers actually experience: fast to produce, useful for aligning stakeholders, but prone to confirming assumptions the team already holds.
A map built from real participant conversations surfaces the moments the team did not anticipate:
A community forum or social media platform they assumed was irrelevant that turned out to be the discovery point
The post-purchase anxiety that drives returns
The competitor comparison happening at a stage where the brand assumed brand loyalty was already secured, when satisfied customers on paper had already started comparison shopping elsewhere
Rigor in journey mapping means grounding every stage in something a real person said, traceable to the conversation it came from. Without that traceability, a journey map is a hypothesis dressed as a finding, and the product decisions, marketing strategies, and business decisions built on it carry more risk than teams typically acknowledge.
Why abandonment analysis fails without upstream evidence
Analytics can tell you that most shoppers who abandon do so at checkout. It doesn't tell you where the doubt began.
This is the core failure of analytics-only diagnosis, whether the source is Google Analytics or similar: the metric flags the last step before leaving, and the team optimizes that step. Checkout abandonment stays flat because the intervention addressed the symptom instead of the source.
The shopper who left at checkout formed that doubt earlier. They likely hesitated at the product detail page over a missing return policy, or scrolled back looking for a size guide, carrying uncertainty about how a return would go if one became necessary. That uncertainty resurfaced at shipping costs and became a decision: leave.
Illustrative: before, the checkout optimization loop. Analytics show checkout abandonment holding steady, the team redesigns the payment form and "save payment info" prompt, abandonment stays flat, and the team tests another element.
Illustrative: after, the upstream evidence loop. AI-moderated interviews reveal trust erosion at the product detail page: shoppers cannot find the return policy, hesitate on sizing, and arrive at checkout uncertain. The team adds trust badges, surfaces the return policy, and clarifies shipping costs earlier, improving the experience customers receive and turning customers who were ready to leave into ones who finish the order. Abandonment falls, customer satisfaction rises, and support teams field fewer tickets.
Upstream evidence is the only difference between the two loops; the analytics are identical. Qualitative interviews, shortly after a session, surface the moment hesitation formed and the exact words a customer uses to explain what made them pause.
Teams that rely on analytics alone tend to run the same optimization cycle, targeting the exit point instead of the origin of doubt. The result is a cleaner checkout, a flat conversion rate, and customer retention and lifetime value that never improve, because the blocker was somewhere the data never pointed.
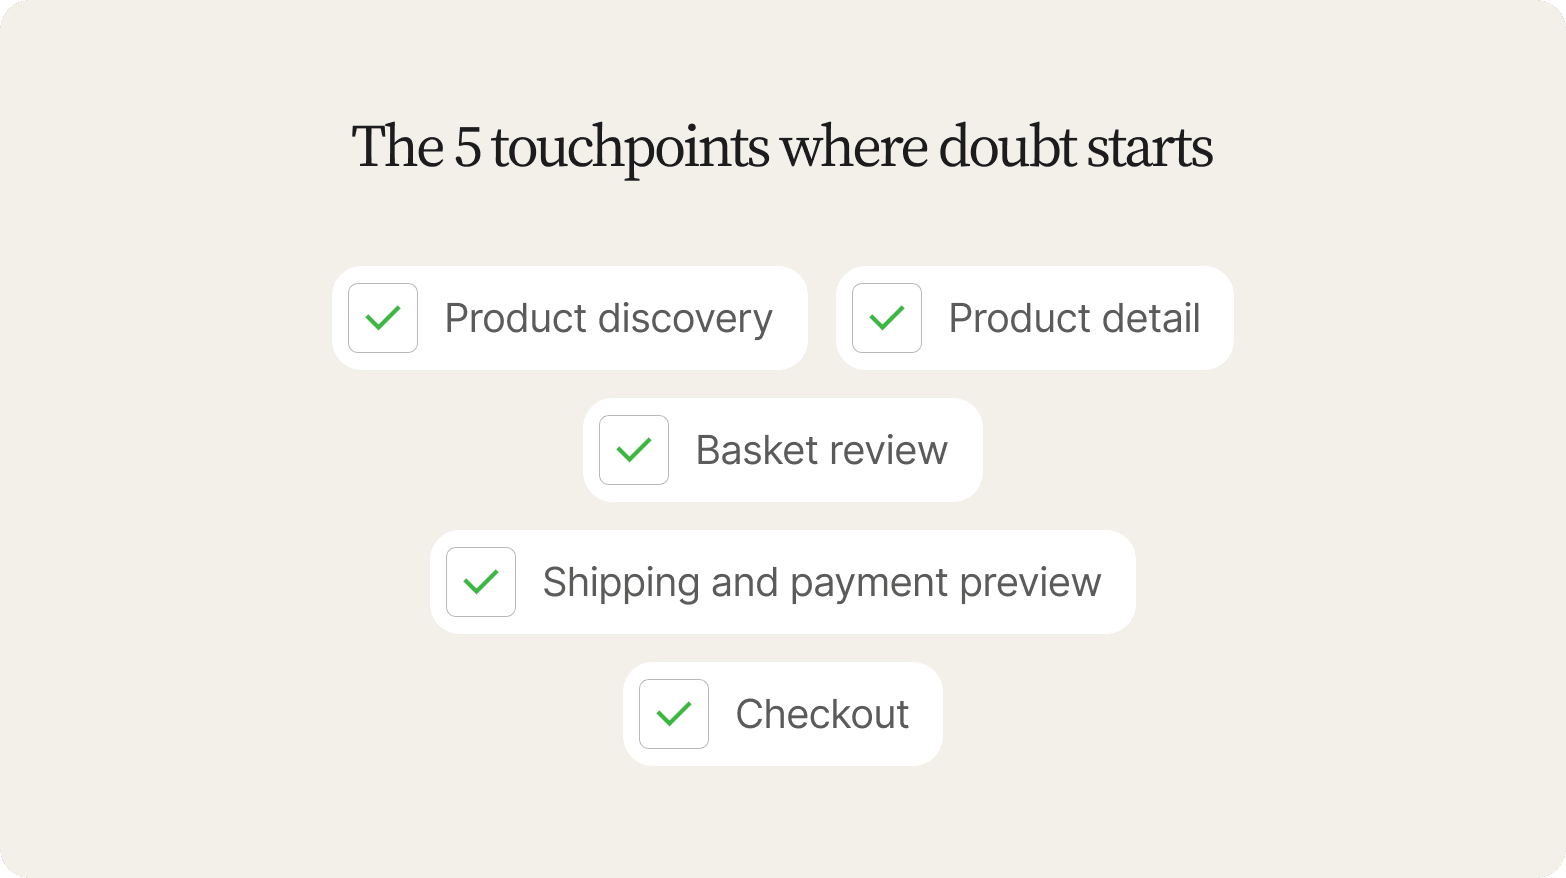
The 5 touchpoints where doubt actually starts
Abandonment metrics tell you where shoppers leave; they rarely explain what made them hesitate three screens earlier, whether a missing size guide, a buried return policy, or an unexpected shipping cost. The five customer journey touchpoints below are where new customers and potential customers most often lose confidence in a purchase they were ready to make.
1. Product discovery: relevance fails silently
For potential customers, that initial discovery often comes through search engines, a social media platform, brand mentions across community forums, or referral traffic from review sites, before they land on a category page, scroll quickly, and exit. First impressions matter here: a shopper who doesn't immediately see something relevant rarely gives a specific brand a second look. Analytics read this as a lack of customer engagement, when it often just means the product range didn't match the target audience, or the imagery never connected.
Behavioral signal: high scroll depth with no click. Research question: What were they actually hoping to find?
2. Product detail: the most fixable hesitation
Shoppers who spend time on a PDP but do not add to cart are often stuck on something specific: a missing size chart, vague material descriptions, or uncertainty about whether the product meets their needs in their particular use case.
Behavioral signal: repeated scroll-backs to the same content block, or a visit to the returns policy mid-session. Research question: Which content gap created the pause?
3. Basket review: a deliberation moment
Shoppers who add items and then remove them, or who sit in the basket without progressing, are often running a mental total or reconsidering the purchase, a deliberation moment more than a commitment.
Behavioral signal: quantity edits, or extended session time with no forward movement.
4. Shipping and payment preview: where price surprises reset decisions
A shopper who appeared committed exits the moment delivery costs appear. Research must distinguish "too expensive" from "I did not expect this," because the fix differs.
Behavioral signal: drop-off immediately after cost reveal.
5. Checkout: where trust and friction collide
Form abandonment mid-field, hesitation at account creation, and tab-switching all signal the same thing: something interrupted the path toward finishing the purchase, creating doubt the shopper could not resolve without leaving.
Behavioral signal: incomplete form fields, or extended dwell time before exit.
Doubt rarely stays confined to one moment in the buying journey; it compounds across multiple touchpoints before a shopper leaves.
In a follow-up interview shortly after a session, the AI research assistant's follow-up gets specific fast: "You mentioned you paused at the delivery cost, what was going through your mind?" That turns a drop-off data point into something the team can actually fix.
Ecommerce journey evidence map
| Touchpoint | Behavioral metric | Qualitative evidence needed | Research prompt |
|---|---|---|---|
| Product discovery | High scroll depth, no click-through | Relevance mismatch or imagery disconnect | "What were you hoping to find?" |
| Product detail | Long dwell, no add-to-cart | Content gap: sizing, materials, use-case fit | "Was there anything you wanted to know?" |
| Basket review | Item removal or quantity edit | Price reconsideration or necessity doubt | "What made you pause before moving forward?" |
| Shipping/payment preview | Drop-off after cost reveal | Price surprise vs. genuine sensitivity | "When you saw the delivery cost, what went through your mind?" |
| Checkout | Mid-field abandonment; tab-switching | Trust gap or friction with a field | "What was going through your mind at that point?" |
How to validate journey maps with research-grade evidence
Credible journey map validation starts with the right evidence architecture.
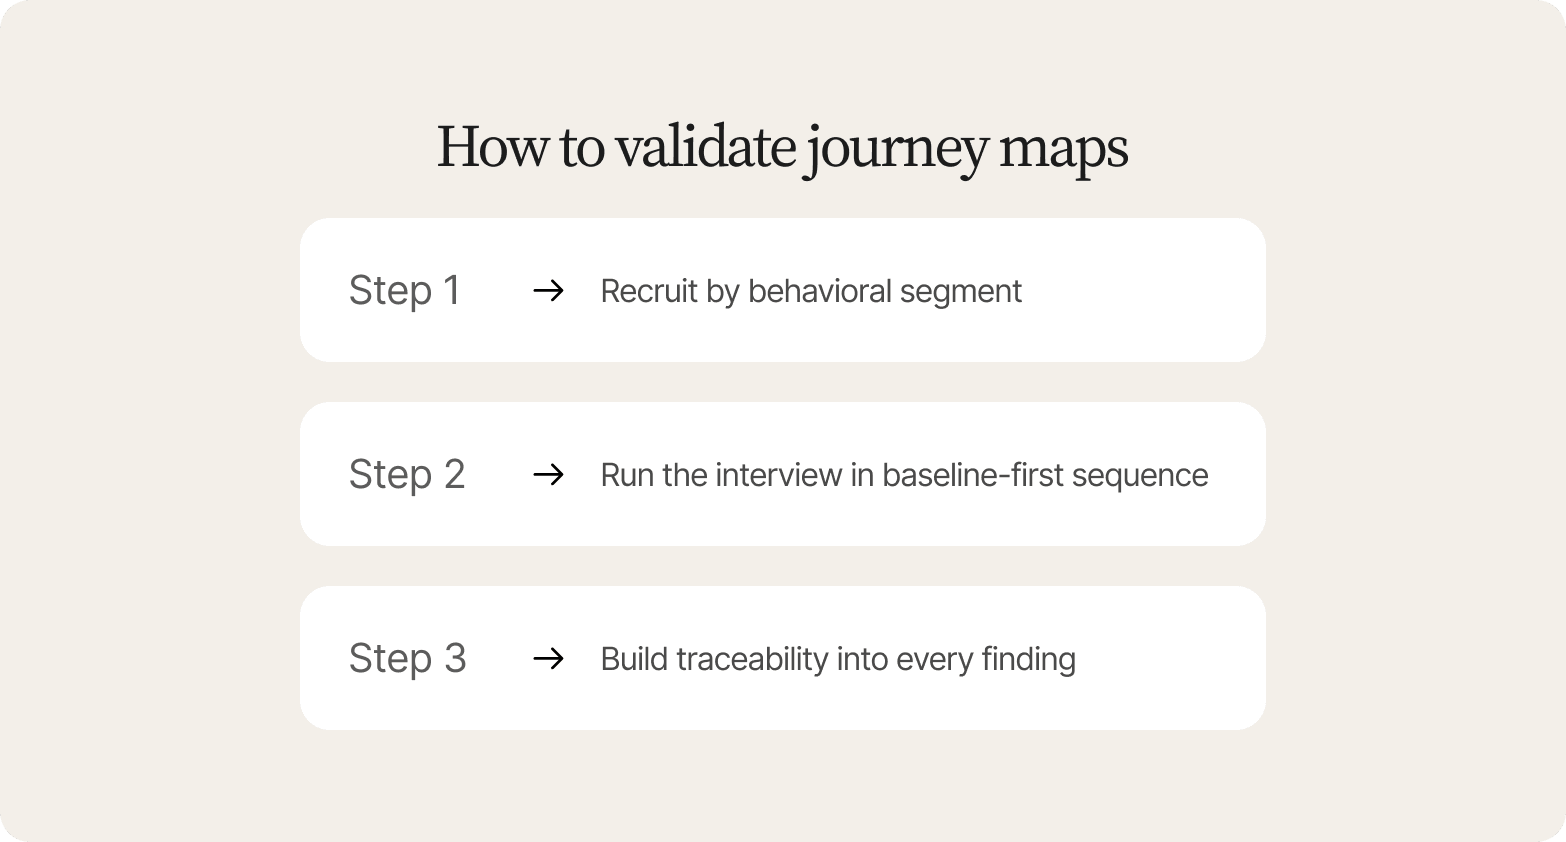
Step 1: Recruit by behavioral segment rather than by demographic category
Target 5 to 15 participants per distinct behavioral segment within the target audience: first-time purchasers, high-abandonment browsers, loyalty members. That maps more precisely to how ideal customers behave than static buyer personas built from demographics alone. Behavioral screeners, applied before a single interview runs, ensure each participant represents the journey stage being studied instead of a typical customer profile assumed in advance.
Step 2: Run the interview in baseline-first sequence
Open by asking participants to narrate their most recent online purchase in their own words, without prompting, surfacing the mental model they hold before any researcher framing influences it. Conveo's AI research assistant adapts its probing to the participant's own language instead of following a rigid guide: when someone hesitates describing a checkout step, that hesitation is where the real friction, and the most valuable customer feedback, actually lives.

Step 3: Build traceability into every finding
Every insight should trace back to the moment a customer speaks in their own words, on video, with a timestamp, instead of a paraphrase. Verbatim quotes and timestamped clips let a CMI director stand behind a finding when someone asks, "But did real customers actually say that?" Every traceable finding also feeds Conveo's searchable insight library, compounding its value past this one study.
The timeline objection is real: traditional qualitative research through agencies can take weeks to schedule and synthesize, so findings often arrive after the team has shipped the next iteration. Asynchronous AI-moderated interviews remove the scheduling bottleneck, with sessions running in parallel across markets in 50+ languages. A global team can, in some cases, move from recruitment to decision-ready findings while the decision is still open, without losing traceability: every session recorded, every quote sourced, every theme linked to the participant who raised it.
Multi-market journey differences that break generic maps
Demographic buyer personas collapse at the border: a "35-to-44-year-old female fashion buyer" behaves differently at checkout in Berlin, London, and Chicago because of payment infrastructure, legal rights, and delivery norms baked into each market, far more than her age or gender.
Behavioral segmentation holds across markets because it maps to motivation: what someone does when they encounter friction, rather than who they are on paper. What changes is the mechanism used to express that buying habit: invoice payment in Germany, buy-now-pay-later in the UK, or a flexible return policy in the US.
The table below maps four touchpoints across three markets. Generic ecommerce customer journey maps miss this layer entirely, and the gap widens further for any business model that layers subscriptions, marketplaces, or B2B wholesale on top of standard retail flows.
| Touchpoint | US | Germany (DE) | UK | Research prompt |
|---|---|---|---|---|
| Payment default | Credit card dominant; BNPL growing | Invoice/PayPal preferred; card trust lower | Cards lead; PayPal and BNPL adopted | "What do you do when your preferred payment isn't available?" |
| Delivery expectation | Speed historically prioritized, reliability closing the gap (McKinsey, 2024) | Predictability and reliability valued over speed | Speed valued; tracking gaps erode trust | "Describe a delivery experience that changed how much you trusted a brand." |
| Trust signals | Brand recognition and star ratings carry weight | Impressum, Trusted Shops, data privacy essential | Online reviews in native language, return policy visibility | "What's the first thing you look for on an unfamiliar site?" |
| Returns policy | Retailer-set; free returns remain a competitive expectation (NRF) | Statutory 14-day withdrawal right (EU Consumer Rights Directive) | Consumer Contracts Regulations 2013; free, trackable returns expected | "How did a returns experience change how you felt about a brand?" |
The risk in multi-market work is sequential regional studies: Germany in Q1, the UK in Q2, the US in Q3, by which time the first market's findings are stale. Conveo's AI-moderated interviews run across 50+ languages simultaneously, so a global team can field the same prompts across all three markets in parallel, comparing trust and payment friction in one synthesis instead of three reports delivered months apart.
Combining qual and quant signals into one shared narrative
Most journey research produces parallel reports that cannot agree with each other. Funnel analytics show a drop-off at product detail; the qual deck, delivered weeks later, points to "general confusion around returns." Neither document references the other, leaving the stakeholder to decide which to trust.
The fix is evidence that lives in the same place and speaks the same language, which data collection alone cannot provide.
When journey claims are built with both a metric and a participant anchor, the narrative holds under scrutiny, which matters when a fix has to be defended in front of leadership.
Consider an illustrative example: Google Analytics data show shoppers exiting at the product detail page without adding to cart, without explaining why. AI-moderated interviews surface the mechanism: participants hesitate when the return policy requires scrolling to find. Participant 7, at 2:14, pauses mid-sentence: "I just can't tell if I can send it back." That moment, timestamped and traceable, is something the product team can act on.
This insight takes the form of a journey map annotation linked to the video clip, the verbatim quote, and the funnel percentage, reading: "Shoppers hesitate at product detail when return policy is unclear." Every claim traces to a real person who agreed to give feedback in their own words. This is where the argument becomes a revenue-risk one: a fix on the wrong touchpoint leaves the cause untouched while the team reports progress against the wrong number.
Keeping journey insights current as site and campaigns change
What customers meet at each touchpoint changes faster than a static map of the buying journey can track.
Journey research has a decay problem most teams underestimate. A homepage redesign ships, new campaigns and social media posts go live, a checkout flow gets restructured, and the journey mapped six months ago stops reflecting the customer lifecycle it's meant to track. Teams keep optimizing for friction points that no longer exist, or miss new ones.
Conveo's searchable insight library, where every interview, theme, and clip is stored and connected across studies, keeps evidence usable long after a study closes. Teams can pull prior findings in seconds to check whether last quarter's behavior still holds, and when a new wave surfaces trends that diverge from the earlier read, that shift is visible instead of drifting into a stale deck.
This matters most when change is fastest: launches, new campaigns, and seasonal transitions are exactly when customer behavior shifts and teams are least likely to have fresh evidence. Conveo StoryLines, part of Conveo's Consumer Understanding Infrastructure, runs wave-based interviews, for example every two weeks or monthly, verifying whether the ecommerce customer journey still holds before a stakeholder meeting rather than after the decision was made.
From static maps to always-on understanding
The gap between where doubt originates and where it surfaces is where most ecommerce customer journey maps mislead their owners. A shopper who abandons a cart at checkout usually started hesitating earlier, on a product page that raised an unanswered question, or at a review that introduced a comparison the brand never anticipated. Attributing that exit to the last touchpoint is a mapping error.
The teams that close that gap run conversations close to the moment of friction, within days instead of weeks. When a shopper describes what they were thinking, the origin of the doubt becomes visible: the difference between a map built from behavioral data alone and one grounded in the complete experience participants actually described.
As channels and campaigns change, that understanding needs to compound across studies. Conveo's searchable insight library keeps prior findings connected, and Conveo StoryLines keeps evidence current on a recurring wave cadence, confirming the customer journey reflects how shoppers move through it now, six months on.
Get this right and the payoff compounds: fixing doubt where it starts turns customers who nearly abandoned into customers who complete the purchase and come back. That's where customer retention, lifetime value, and customer engagement come from: the positive experience shoppers describe to friends, the reviews they leave for the next shopper deciding, and whether a brand earns loyalty or a single transaction. For ecommerce businesses competing on similar price points and shipping speeds, that compounding effect is often the more durable competitive advantage.
The benefits are tangible: fewer abandoned carts, stronger customer satisfaction, more first-time buyers who become repeat customers, and a checkout flow the team stops defending.
"Every marketing decision we make now starts with what consumers actually told us on Conveo."
Louis Chalabi, Founder & CMO, Edgard & Cooper
Frequently asked questions
What is an AI-moderated interview?
An AI-moderated interview is a structured qualitative research conversation in which an AI research assistant follows a researcher-defined guide, follows up on what participants say, and probes for the reasoning behind their answers, without a human moderator present. The AI adapts in real time, so depth reflects what each participant brings. Sessions run asynchronously and in parallel across markets and languages, producing structured transcripts and thematic analysis that provide insights as each recording closes.
Are AI-moderated interviews as rigorous as human-moderated ones?
Rigor in qualitative research depends on study design, discussion guide quality, and the analytical framework applied to findings, whoever conducts the session. AI moderation applies a consistent approach across every participant, reducing interviewer variability and social desirability effects, so what participants share reflects how customers feel rather than what they think a moderator wants to hear. Participants also tend to be more open on sensitive topics, since AI removes the perceived judgment of a human interviewer. The findings are only as trustworthy as the methodology behind them, which is why platforms built by researchers produce more credible outputs.
When should I use AI-moderated interviews instead of a human moderator?
AI moderation suits studies where scale, speed, or geographic reach make human moderation impractical: large-sample concept tests, multi-market brand studies, continuous discovery programs, and voice-of-customer work for any product or service running on a recurring basis, whether onboarding process or renewal, wherever customers interact with a brand along the buying process. Human moderation remains stronger for highly sensitive topics, vulnerable populations, or exploratory work needing real-time decisions beyond a defined guide. Conveo augments human researchers rather than replacing them.
Can AI moderation handle multiple languages?
Yes. Platforms with multilingual AI moderation can conduct interviews in the participant's own language without a separate human moderator or translation step. Conveo's AI research assistant operates across 50+ languages, with transcription and translation built in, so a multi-market study doesn't need separate teams for each target market.
How do I know the findings from AI-moderated interviews are traceable?
Every finding should trace to a specific participant, supported by verbatim quotes and, where video is captured, a timestamped recording. Platforms relying on AI-generated summaries without source attribution create a credibility problem when findings reach stakeholders who need to trust the evidence behind a business decision, the same standard that applies to brand mentions used as proof points and to participants who provide feedback. Can you show a skeptical stakeholder who said what, in what context, and in their own words?

About the author
Alex de Hemptinne
Head of Customer Success
Alex is a Business Impact Lead at Conveo, partnering with enterprise teams to embed AI-led research into their workflows. From the first study to full-scale rollout, she helps customers shift from project-based research to continuous customer intelligence.
Meet Alex on film →Qualitative insights at the speed of your business.
Conveo runs AI-moderated video interviews and structures everything they say.