In this article
TL;DR
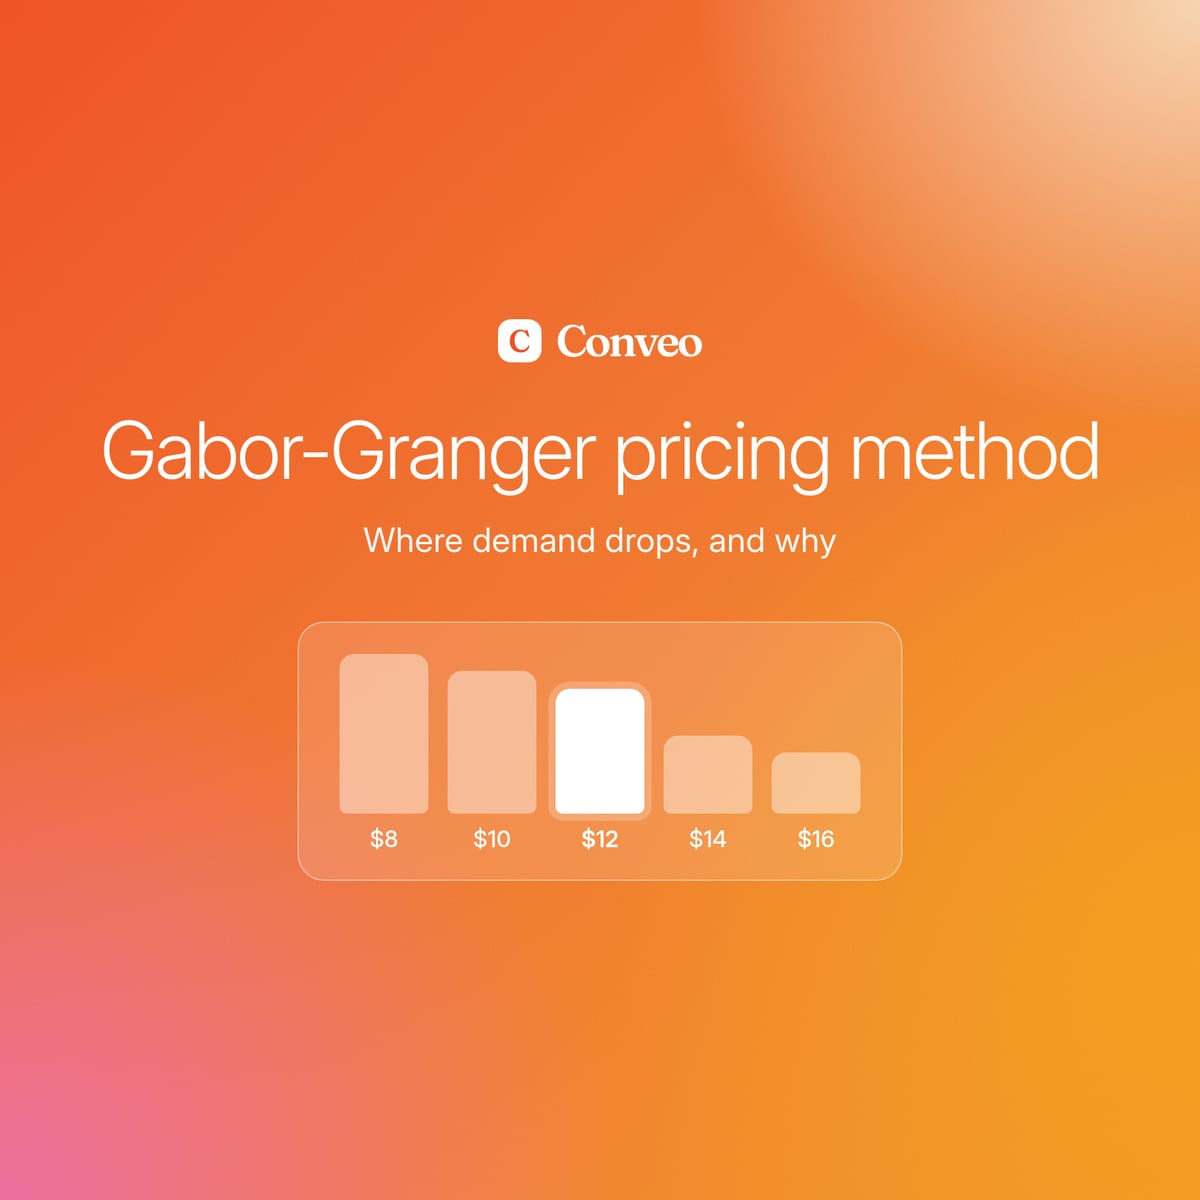
Gabor-Granger is a survey-based pricing technique that asks participants whether they would buy at a series of predefined prices to build demand and revenue curves.
A Gabor-Granger curve shows where demand bends; it cannot show why participants stop buying at a given price.
Adding a "why" at each price point, ideally inside the same conversation, makes the curve defensible. AI-moderated interviews capture both in one session.
Best for: pricing leads who need a revenue-maximizing price for a defined offer within a known range.
On your Gabor-Granger curve, demand drops sharply at a single price point, and nobody in the room can explain why. The pricing lead has a clean chart, a recommendation due Friday, and no answer. By the time the reasoning arrives the final price has usually already shipped.
The method captures a yes-or-no at each price, so the curve shows where demand bends but never why. Each round of price changes then restarts from stated intent alone.
This guide is for pricing leads and market research teams who need a study they can defend. It covers the method, a step-by-step build, how to read the curve, the Van Westendorp comparison, and how to capture the reasoning behind the bend. Pricing research gets stronger when the curve explains the reason.
What is the Gabor-Granger method?
The Gabor-Granger method is a sequential pricing technique in which participants state purchase intention at a series of specific price points. It produces a demand curve and a revenue-maximizing price.
Sawtooth Software credits economists André Gabor and Clive Granger as the creators of the Gabor-Granger pricing technique, and Conjointly dates its use to the 1960s. The Gabor-Granger pricing model fits best when a team is pricing a single product or service and a plausible price range already exists. It is a weaker choice when nobody yet knows what the category should cost; there, the Van Westendorp pricing model brackets the range first.
The method is fast to field, but it tests one product in isolation, with no competitive market context.
Sawtooth Software describes a three-part output. A demand curve shows the share of participants willing to pay each price, a proxy for quantity demanded. A revenue curve multiplies each price by that share to estimate potential revenue, and the optimal price point maximizes revenue. The slope of the demand curve also gives a rough read on price elasticity.
Gabor-Granger results look precise, but a yes-or-no at each price offers no reasoning. The team knows the number, but not whether it is the right price point or what produced it.
How to run a Gabor-Granger pricing test, step by step
A Gabor-Granger pricing test follows five steps: define the grid, choose and randomize the starting price, write the question, set the sample, and plan analysis.
Define the product, the offer, and the price range. Build a price list of predefined prices, evenly spaced and anchored to current pricing, the main competitor's price, and the cost floor. The cost floor sets the minimum price, and the maximum price should sit above the level where purchase likelihood is expected to fall. Include enough price points to show where demand bends.
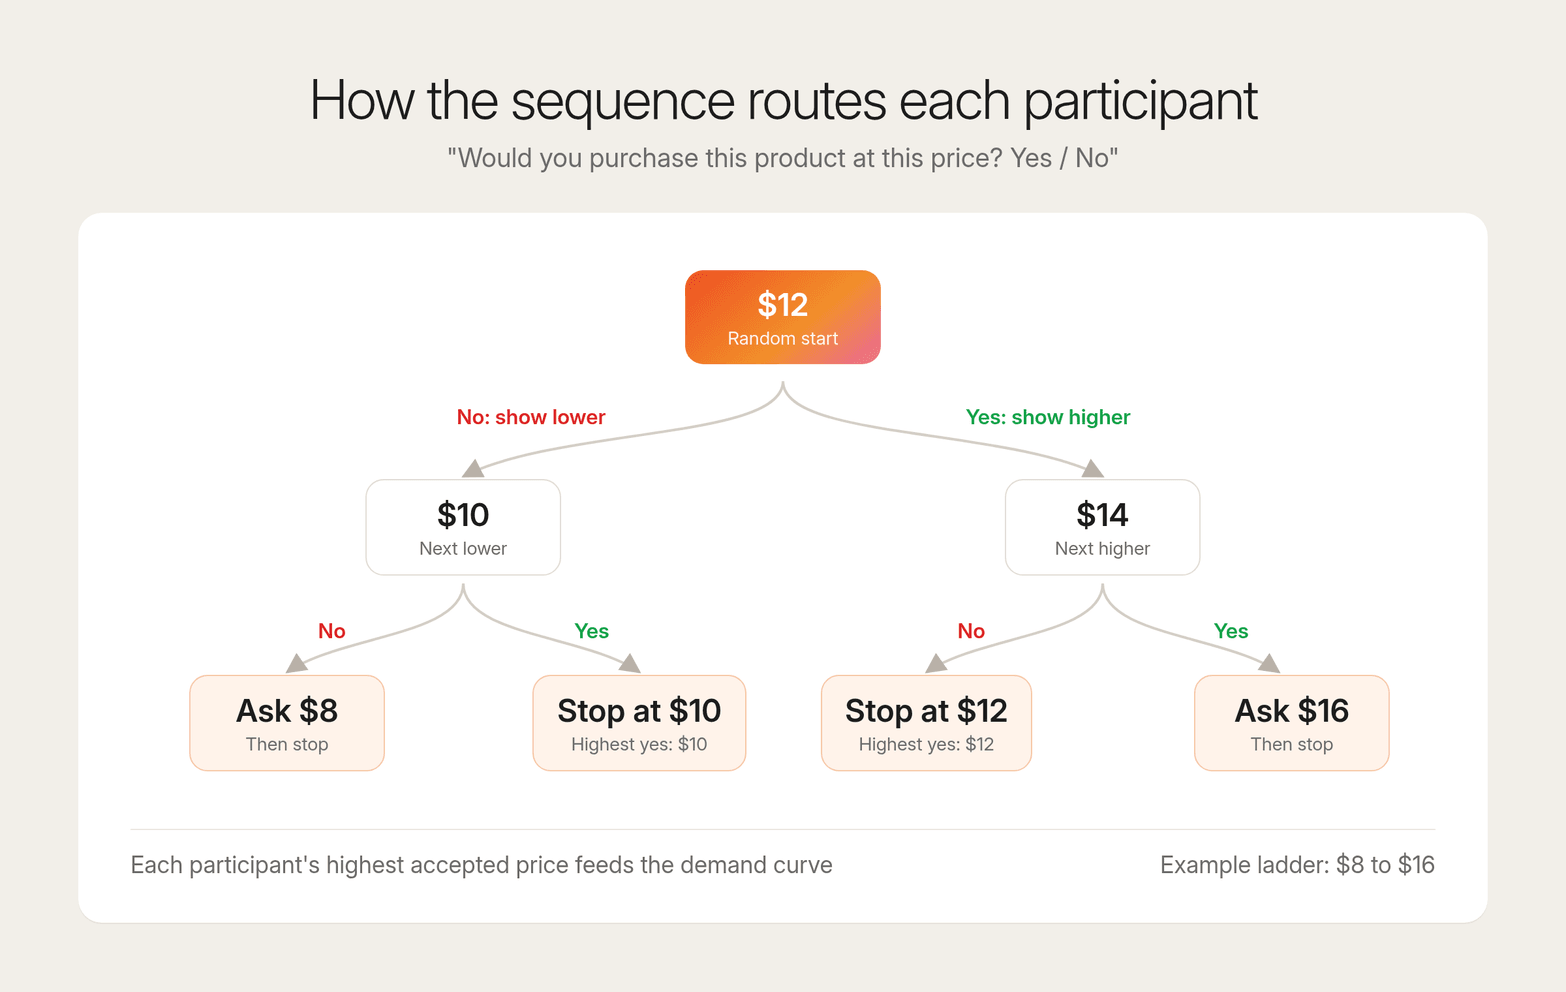
Choose and randomize the starting price. The sequence can start at a random price or run ascending or descending, and Sawtooth Software notes that a random start helps reduce bias, though it complicates routing logic. Randomizing the initial price across participants keeps one first number from anchoring every later answer; Qualtrics, for example, picks the first price at random from the middle third of the range.
Keep Gabor-Granger pricing questions to one product and one price per screen: "Would you purchase [product] at [price]? Yes / No." After a yes, the Gabor-Granger survey shows the next higher price; after a no, it shows the next lower price.
Vendor guidance from SurveyMonkey and Conjointly sets at least 100 completes per segment analyzed separately. Plan for more when comparing customer segments.
Plan the analysis before fieldwork: calculate the cumulative percentage answering yes at each price, counting a yes at lower prices for anyone who accepted a higher one. Plot the demand curve from the minimum price to the highest price point, then multiply each price by its demand share to plot the revenue curve.
A spreadsheet can compute both curves from per-participant price columns. Use one column per price on the price list, with a 1 or 0 in each cell, and keep survey data at participant level alongside segment and screener fields. You can then split the revenue curves by segment without refielding.
Stated purchase intention tends to exceed real purchase, though Conjointly notes participants may also understate willingness to pay to keep prices down, and the two biases mostly cancel out.
Run correctly, this sequence produces a defensible curve. Capturing why participants said no at a given price requires a different instrument.
How to read a Gabor-Granger demand curve
The revenue-maximizing price is the point where price times the share of participants willing to pay it peaks. Reading the curve means finding that peak and testing how stable it is.
| Price | Participants answering yes | Revenue index (price × share) |
|---|---|---|
| $8 | 78% | 6.24 |
| $10 | 70% | 7.00 |
| $12 | 61% | 7.32 |
| $14 | 38% | 5.32 |
| $16 | 30% | 4.80 |
Illustrative Gabor-Granger example for a premium 4-pack of cold brew. Hypothetical numbers, not customer or Conveo data.
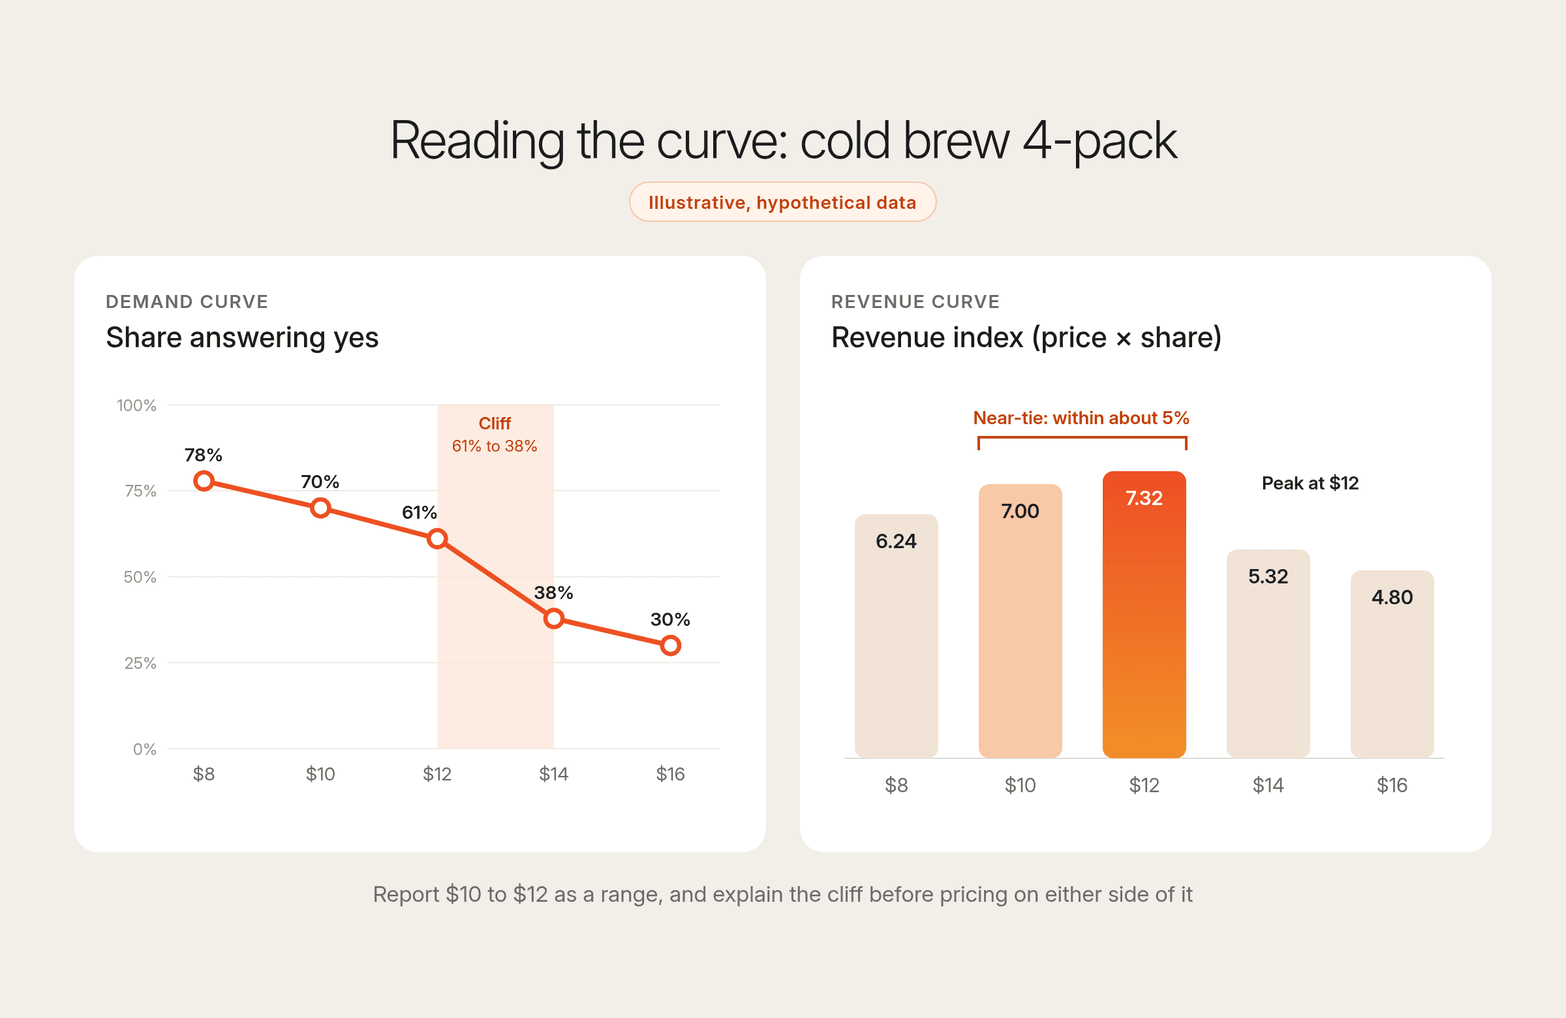
The decision rule: choose the price with the highest revenue index, then check the neighboring prices. Here, $12 leads at 7.32, the highest potential revenue in the grid.
A gradual slope suggests moderate price elasticity, with sensitivity spread across the sample. A steep drop between adjacent price levels suggests a price threshold one group shares. Cut the curve by customer segments before treating either pattern as market-wide.
When two prices produce revenue indices within about 5%, as $10 and $12 do here, the difference may not be statistically meaningful. Sound Gabor-Granger analysis reports confidence intervals or flags near-ties and presents the result as a $10-to-$12 range instead of a single price point.
The table also shows a cliff: a sharp decline from 61% to 38% between $12 and $14. That drop could be real, a grid artifact, or a framing effect, and the curve alone cannot distinguish them. That gap is one of the core limitations of quantitative research. Explain a cliff like this before recommending a new price on either side of it.
Gabor-Granger vs Van Westendorp: which pricing method fits your question?
Gabor-Granger estimates demand and revenue at specific prices, while Van Westendorp identifies an acceptable price range from four perception questions. The right choice depends on whether the team already knows the range it is pricing within.
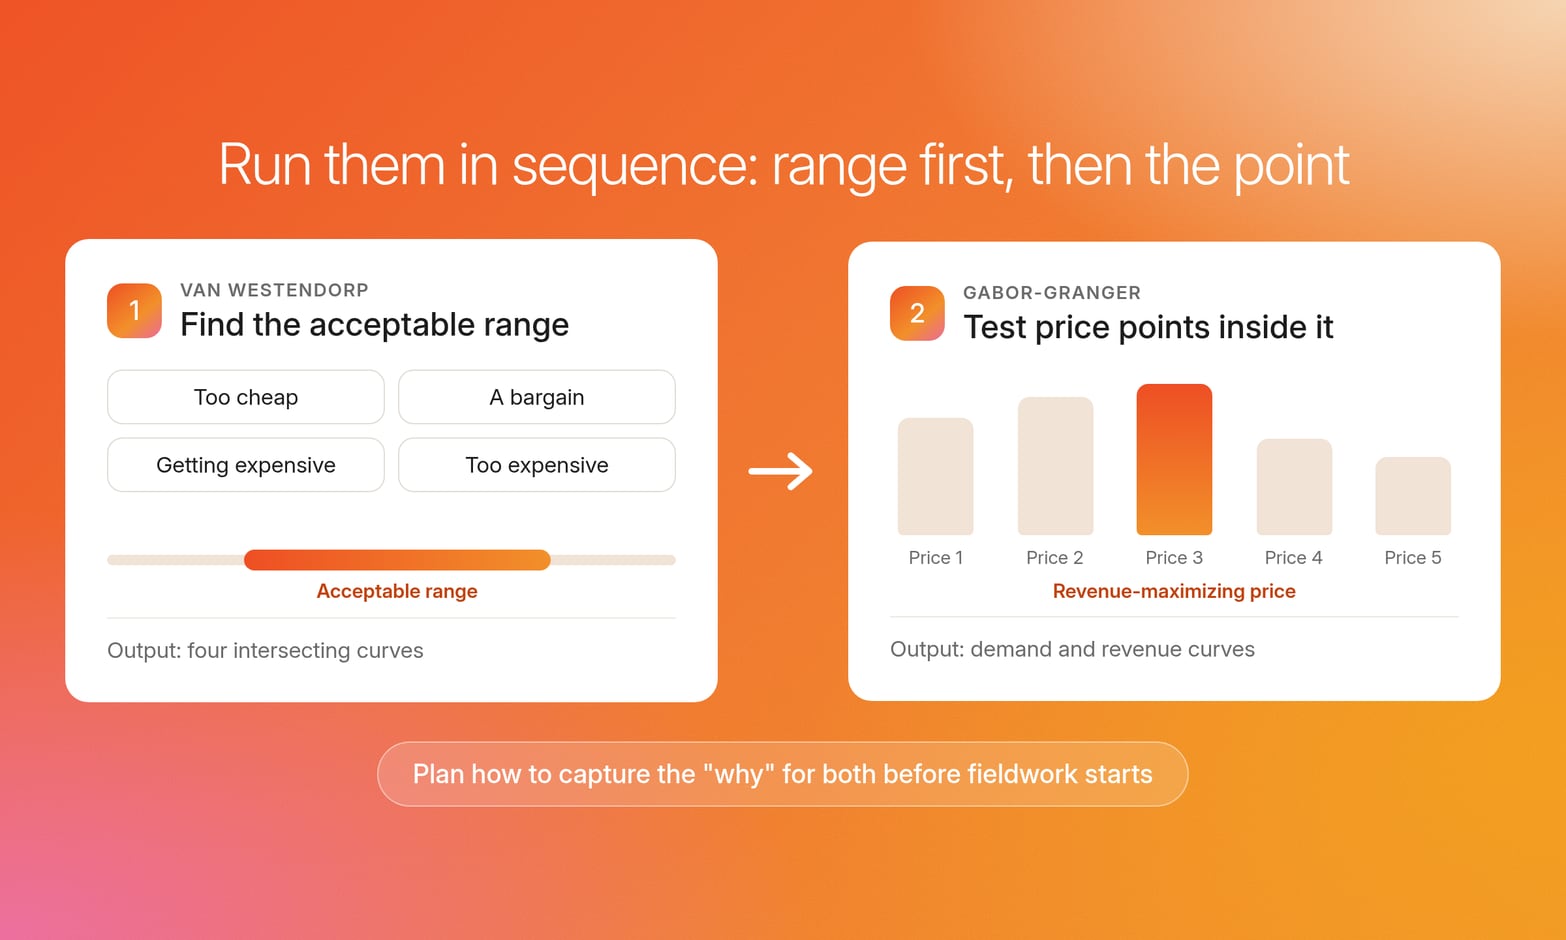
The four Van Westendorp Price Sensitivity Meter questions ask at what price a product feels too cheap, a bargain, getting expensive, and too expensive. Together, those answers map customer perceptions of value and bracket the minimum and maximum prices buyers will accept.
The Newton-Miller-Smith extension adds two purchase-intent questions for a rough revenue projection, which the standard method lacks.
| Dimension | Gabor-Granger | Van Westendorp |
|---|---|---|
| Core question answered | Revenue-maximizing price at tested points | Acceptable price range |
| Output | Demand curve and revenue curve | Four intersecting curves |
| Best fit | Pricing a defined offer within a known range | Early-stage products with an unknown price range |
| Main limitation | Stated intent without reasoning | No demand or revenue estimate (standard version) |
The two methods work best in sequence. Use Van Westendorp to find the acceptable range, then Gabor-Granger to test specific price points inside it. Teams that frame the decision as Van Westendorp vs. Gabor-Granger often run one method when the question needed both.
Both methods show where customer perception shifts, but neither explains why. A participant who calls a price "too expensive" gives the same answer whether the issue is value, budget, or a cheaper alternative they already use.
Conveo's position: choose the method by the question, and plan how to capture the "why" for either one before fieldwork starts.
Why a Gabor-Granger curve needs the reasoning behind it
A Gabor-Granger curve shows where demand drops sharply, and the reasons for that drop determine whether the price is defensible. Without that reasoning, a pricing strategy rests on shape alone.
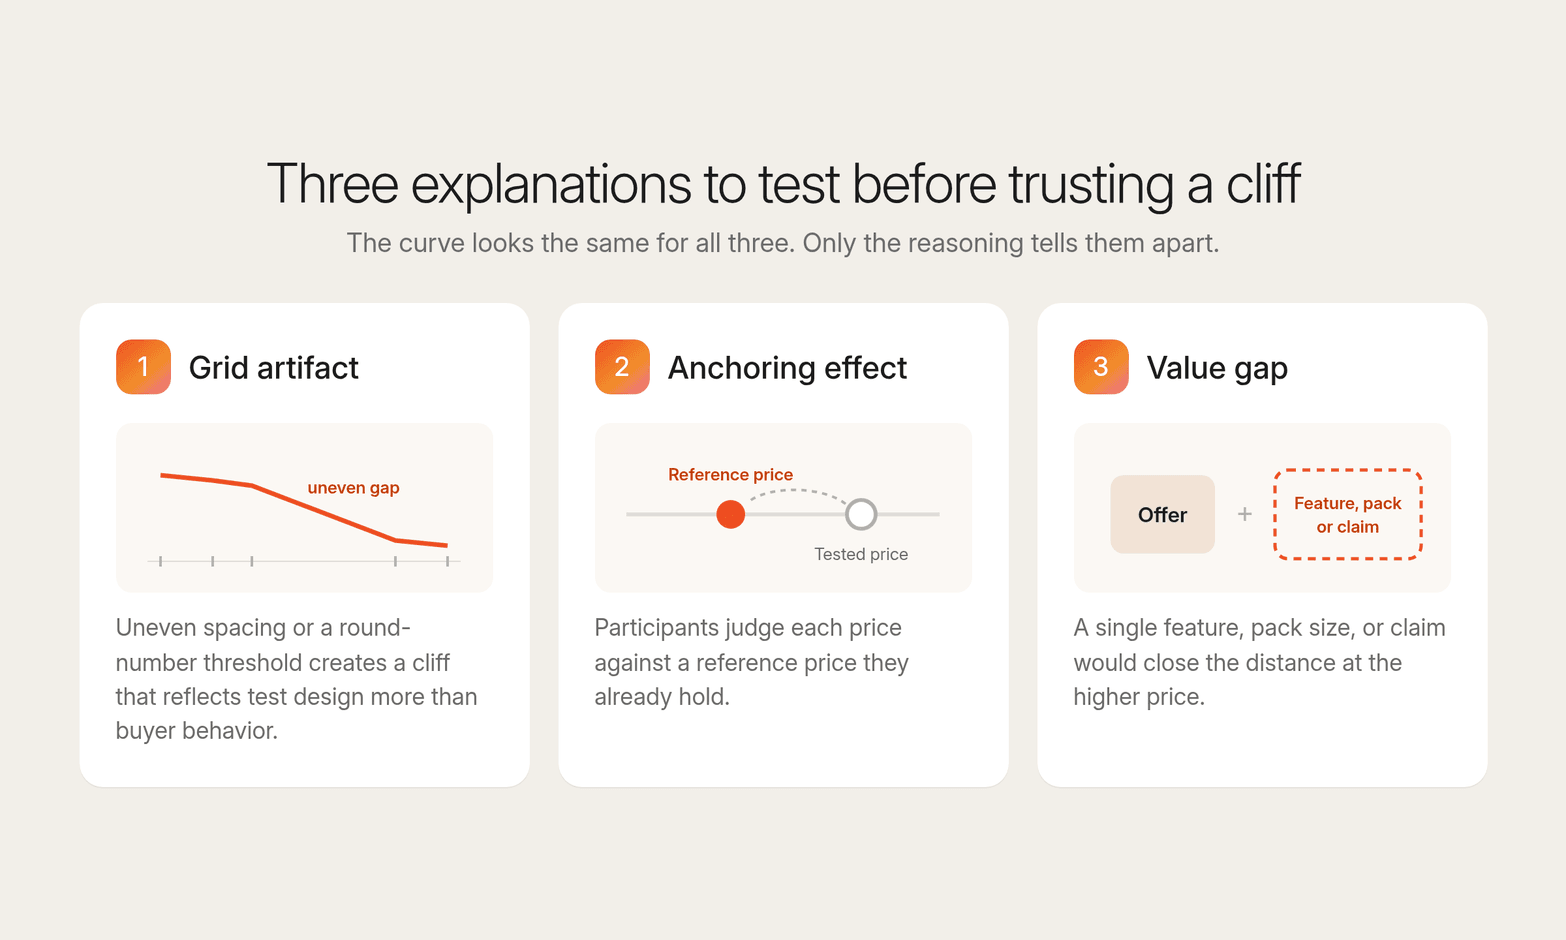
Finance, product, and executives all ask the same question: what is causing the drop, and would a different price or offer move it? A Gabor-Granger survey built on stated intent cannot answer. Three explanations deserve testing before anyone treats a drop as real.
A grid artifact, where uneven spacing or a round-number threshold creates a cliff that reflects test design more than buyer behavior.
An anchoring effect, where participants judge each price against a reference price they already hold.
A value gap, where a single feature, pack size, or claim would close the distance at the higher price.
A Conveo price sensitivity testing study tested a streaming service bundle, YouTube Premium plus Peacock, with 399 people who watch YouTube at least weekly but don't subscribe to Premium. At the current $15.99 price, adding Peacock nearly doubled stated willingness to subscribe, from 8% to 15%. Conveo's probing suggested the lift was driven primarily by subscription consolidation among people who already pay for Peacock.
In the same study, rejection at the lowest tested price ($5.99) fell from 40% to 28%. The modeled revenue-optimal price rose 33%, and modeled revenue per 1,000 consumers rose 22%.
The same curve supports two opposite recommendations until the reasoning is known. Read as genuine consumer interest, the lift invites price increases and a premium launch. Read as consolidation, it ties the price to what households already spend on separate monthly subscriptions.
Participants also name what they currently pay for each streaming service and which alternatives they benchmark, which shows the real reference set shaping willingness to pay. That reference set is what separates the right price from the point where the curve happened to peak.
How to run Gabor-Granger inside AI-moderated interviews
Running Gabor-Granger inside AI-moderated interviews means every yes or no at a price point is followed by an in-the-moment "why," in the same conversation.
Pricing teams often collect the curve in a pricing survey and chase the reasoning later in a separate qualitative market research study. By then, the participants differ, and the decision window has narrowed. That split is the gap mixed methods research designs exist to close.
Researchers keep ownership of the design: in Conveo, they add a Pricing question to the main interview, then set a currency per market and a price ladder for each currency. Pricing is currently a research preview: it can't be used in screeners or in sections that rotate stimuli sequentially, and results carry a caution below 30 valid participants. Participants first answer a structured price step, and Conveo's AI research assistant follows up on the price answers you choose.
Researchers write those follow-ups into the guide, for example, asking what would justify a price increase, such as pack size, a premium ingredient, or a sustainability claim.

Hesitation becomes evidence. Conveo's analysis covers speech, tone, and facial cues across every session, so hesitation at a price point sits in the record next to the yes or no. That surfaces objections that are harder to capture from survey data alone, with no separate qual follow-up.
"Consumers did a live unboxing for us: seeing it for the first time, giving us their first reactions. They don't have time to rationalize. It's all emotive, in that moment."
Dafydd Jones, Associate Director, Ninth Seat
Stakeholders can verify the recommendation themselves. Researchers can open the interviews behind any price tier, so the Gabor-Granger pricing analysis keeps the reasoning attached to each price tier.
Watch the walkthrough: Gabor-Granger pricing in a Conveo interview.
Findings arrive while the pricing decision is still open, in time for the next pricing strategy review.
Running Gabor-Granger across markets
Multi-market Gabor-Granger pricing studies require localized price stimuli. A grid converted at exchange rates tests currency math and misses how each market prices the category.
Converted prices land on uneven figures no local shopper sees, so the curve can pick up a sharp decline the market would never produce. Compare those Gabor-Granger results across countries and the team ends up comparing artifacts.
Build each market's grid from local evidence: local currency, the price endings and price thresholds shoppers expect, the local reference price, and consistent relative spacing between price levels. Keep question wording, routing, and randomization identical across markets so any differences reflect market context.
Conveo's AI-moderated interviews run in 50+ languages, and one pricing question can run across 12 currencies, so participants explain the reference set behind each answer in their own language.
Why run Gabor-Granger with Conveo
What the Gabor-Granger method offers, a demand curve and a revenue curve, stays the same inside Conveo. What changes is that each price tier comes with the participant's own words, while researchers keep design control over the grid, the currency, and the probe. When finance questions a near-tie or a cliff, the team can open the interviews behind it and show exactly what drove the final price.
Frequently asked questions
What is a good sample size for a Gabor-Granger study?
Vendor guidance sets a planning floor of at least 100 completes per segment analyzed separately, with more needed when customer segments will be compared against each other. Conveo also flags results below 30 valid participants with a caution.
What is the difference between Gabor-Granger and Van Westendorp?
Gabor-Granger estimates demand and revenue at specific price points. Van Westendorp identifies an acceptable price range from four perception questions and, in its standard version, gives no demand or revenue estimate. Many teams run Van Westendorp first, then Gabor-Granger inside the range it finds.
How is Gabor-Granger different from conjoint analysis?
As a survey-based pricing technique, Gabor-Granger tests one product in isolation across different price points, with no competitive context, while [conjoint analysis](/glossary/conjoint-analysis) tests multiple attributes, including pricing options, simultaneously. The Gabor-Granger model is faster to field but answers a narrower question.
How many price points should a Gabor-Granger study include?
Many guides use around five price points: [SurveyMonkey's guide](https://www.surveymonkey.com/learn/product-development/gabor-granger/) uses a five-point price ladder, and [Qualtrics](https://www.qualtrics.com/support/common-use-case/xm-solutions/pricing-study-gabor-granger/) requires at least four. Space them evenly, anchor them on current pricing, the main competitor's price, and the cost floor, and set the highest price point above where you expect demand to fall.
Do Gabor-Granger pricing studies work across multiple markets?
Yes, with localized price stimuli built from local currency, price endings, and reference prices rather than prices converted at a flat exchange rate. Identical wording, routing, and randomization across markets isolate genuine market differences from conversion artifacts.

About the author
Alex de Hemptinne
Business Impact Lead
Alex is a Business Impact Lead at Conveo, partnering with enterprise teams to embed AI-led research into their workflows. From the first study to full-scale rollout, she helps customers shift from project-based research to continuous customer intelligence.
Meet Alex on film →Qualitative insights at the speed of your business.
Conveo runs AI-moderated video interviews and structures everything they say.