In this article
TL;DR
Mixed methods research combines qualitative and quantitative methods in one study so the findings answer both "how many" and "why."
Most commercial teams field a survey and a round of interviews or focus groups, then report the quantitative and qualitative findings in adjacent sections of one deck.
Integration gets claimed in the method and disappears from the findings because no survey result traces to a participant, quote, or clip.
Three designs cover most commercial research questions: convergent, sequential explanatory, and sequential exploratory. Each carries its own integration risk.
The fix: collect qualitative and quantitative data from the same participants in one program, and keep every claim traceable to a quote or clip.
Most insights teams already run mixed methods research. The survey goes out, interviews follow, and both land in the same readout. When a stakeholder asks why a number moved, the answer often sits in a separate study, with different participants, and arrives after the decision has closed.
This guide covers the three designs commercial teams use, why integration breaks down in practice, and four practices that put the number and the reason in one evidence base, from joint displays to a traceability convention.
What is mixed methods research?
Mixed methods research combines qualitative and quantitative methods in one study so each strand informs the other, and the findings answer both "how many" and "why." Put simply, it is a study in which qualitative and quantitative data share one evidence base. That is what mixed methods research offers: a more comprehensive understanding than either strand delivers alone.
For commercial teams, combining the two makes practical sense. Surveys quantify stated preferences and support statistical analysis, but quantitative research has blind spots: hesitation, contradictions, and the language people use. A participant can rate a price as fair and still abandon the cart, and only qualitative approaches like interviews show why. Those gaps are where launch, pricing, and positioning calls go wrong.
Where mixed methods research breaks in practice
In practice, a survey report and an interview report land in the same quarterly deck. Slide 14 shows purchase intent dropping among lapsed buyers, and slide 22 carries three anonymous quotes about price from a separate round of focus groups. No one can say whether the quoted people are the ones who dropped, because no claim traces to a clip.
Survey, behavioral, and interview data live in separate systems, so teams reconcile quantitative results and qualitative findings by hand, and the integrated story never gets built. Running multiple methods without synthesis produces parallel reports.
Agency cycles for qualitative research methods often take several weeks and widen the gap, because the interview report often lands after the survey has shaped the brief. The alternative is a quantitative interview, where structured questions and the follow-up "why" happen in the same session.
Teams decide on integration when they choose their data collection methods, long before anyone drafts the write-up.
Mixed methods research design: the 3 patterns commercial teams use
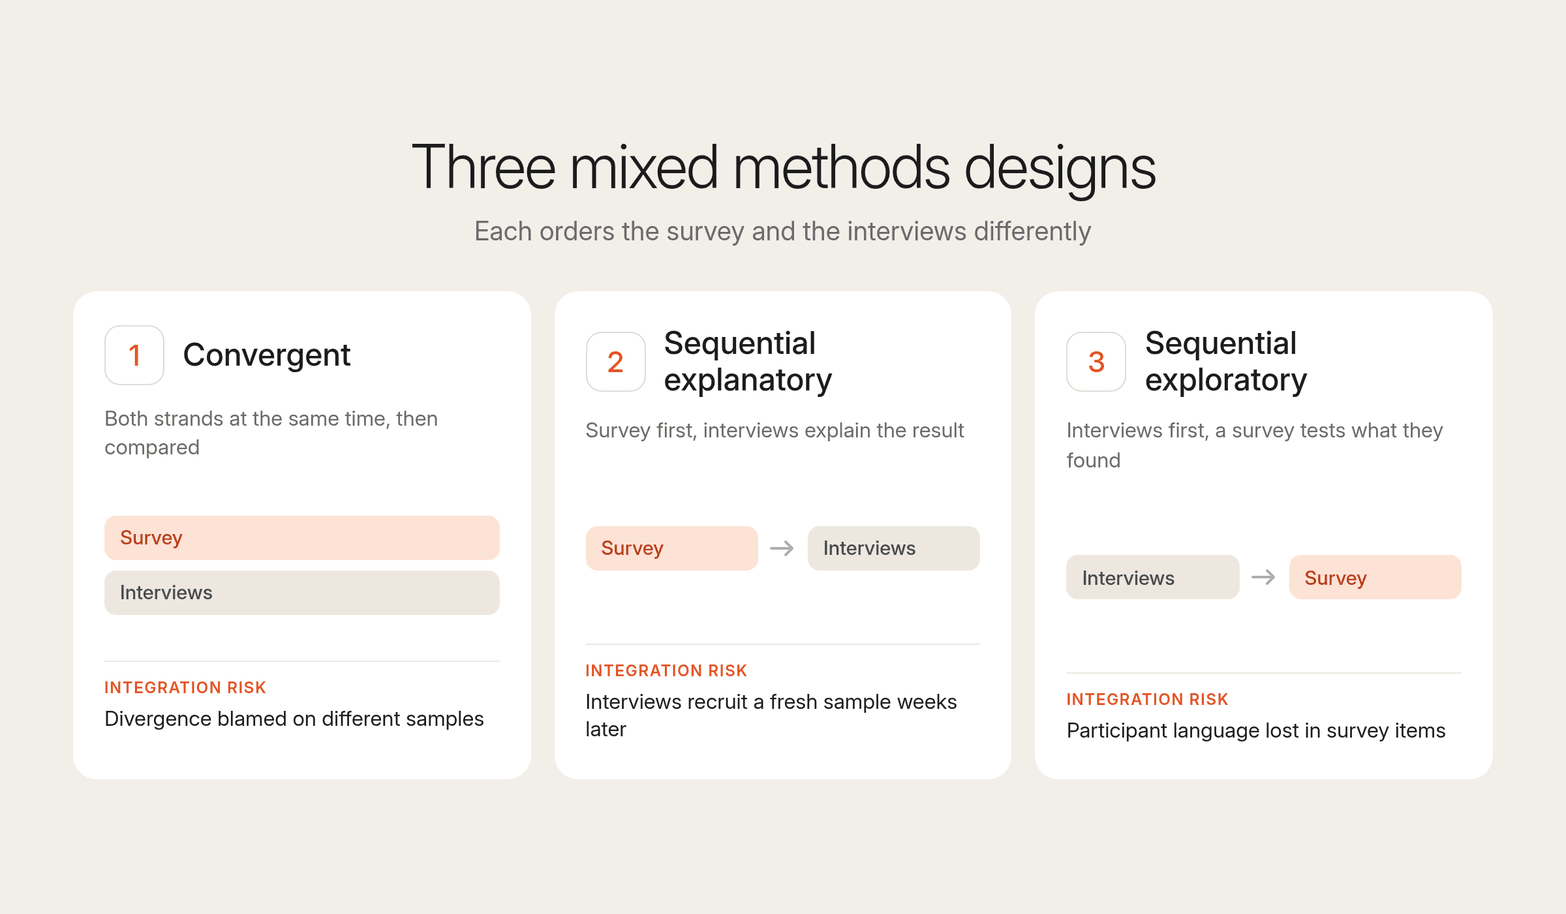
Three types of mixed methods research cover most enterprise insights and marketing work: convergent, sequential explanatory, and sequential exploratory. Each mixed methods research design orders the qualitative and quantitative approaches differently, answers a different commercial question, and carries its own integration risk. An embedded design nests a smaller strand inside any of the three.
1. Convergent
A convergent design runs both strands at the same time, then compares where the quantitative and qualitative results agree and diverge. In a concept test, a survey scores three concepts on appeal and purchase intent while interviews explore reactions to the same stimuli. Neither strand waits for the other.
The risk sits at the comparison step. When the survey ranks Concept B first and interview participants favor Concept A, teams cannot tell real tension from two different samples, so they explain away the divergence.
2. Sequential explanatory
A sequential explanatory design, also called an explanatory sequential design, is one in which the investigator gathers quantitative data first, then uses a qualitative phase to explain results that need explanation. In brand perception work, a tracker shows consideration slipping among 25- to 34-year-olds, and follow-up interviews ask why. Most teams default to this design.
The risk is timing and selection. Follow-up interviews often recruit a fresh sample weeks later, so the people explaining the drop are not the people who reported it, and the explanation becomes an inference about one group drawn from another.
3. Sequential exploratory
A sequential exploratory design, also called an exploratory sequential design, starts with interviews to surface qualitative themes and language. The following survey is built to test the hypotheses the interviews generated. Pricing work often runs this way: interviews reveal how buyers frame value and which tiers confuse them, then the team uses a survey to collect quantitative data on each pattern.
The risk is losing meaning during data transformation. When the team rewrites participant language into tidy answer options, the survey measures the researcher's categories instead of the customer's, and the link back to the original conversations disappears.
| Design | Order of strands | Typical commercial use | Integration risk |
|---|---|---|---|
| Convergent | Both at the same time | Concept tests | Divergence blamed on different samples |
| Sequential explanatory | Survey first, interviews second | Brand tracking follow-ups | Interviews recruit a fresh sample weeks later |
| Sequential exploratory | Interviews first, survey second | Pricing and value framing | Participant language lost in survey items |
All three designs fail the same way when the survey and the interviews come from different participants: the strands sit side by side, and no survey answer connects to a person who explained it.
Conveo argues that the choice of mixed methods design matters less than whether the qualitative and quantitative components can inform each other. That is the case for a mixed methods approach where the number and the reason come from the same person in the same session.
Why integration is claimed in the method and absent from the findings
Four failure modes sit behind adjacent-section reporting, where qualitative and quantitative findings share a deck but never meet. These are the practical disadvantages of mixed-methods research as most teams run it: a deck that looks integrated but reads like two studies.
Separate systems. Recruitment, moderation, transcription, and analysis run in different places, with different analysis methods in each, so someone reconciles exports by hand. The integrated story gets dropped the night before the readout.
Different participants across strands. Separate participant recruitment for each strand means no survey answer can be explained by an interview, so any link assumes two groups think alike.
Timelines. Qualitative cycles that often take several weeks deliver interview findings after the brief locks or the decision ships. The quantitative findings make the call alone.
No traceability. Stakeholders discount conclusions they cannot trace to a participant, quote, or timestamped moment. An unsupported theme like "price sensitivity" rarely survives first review.
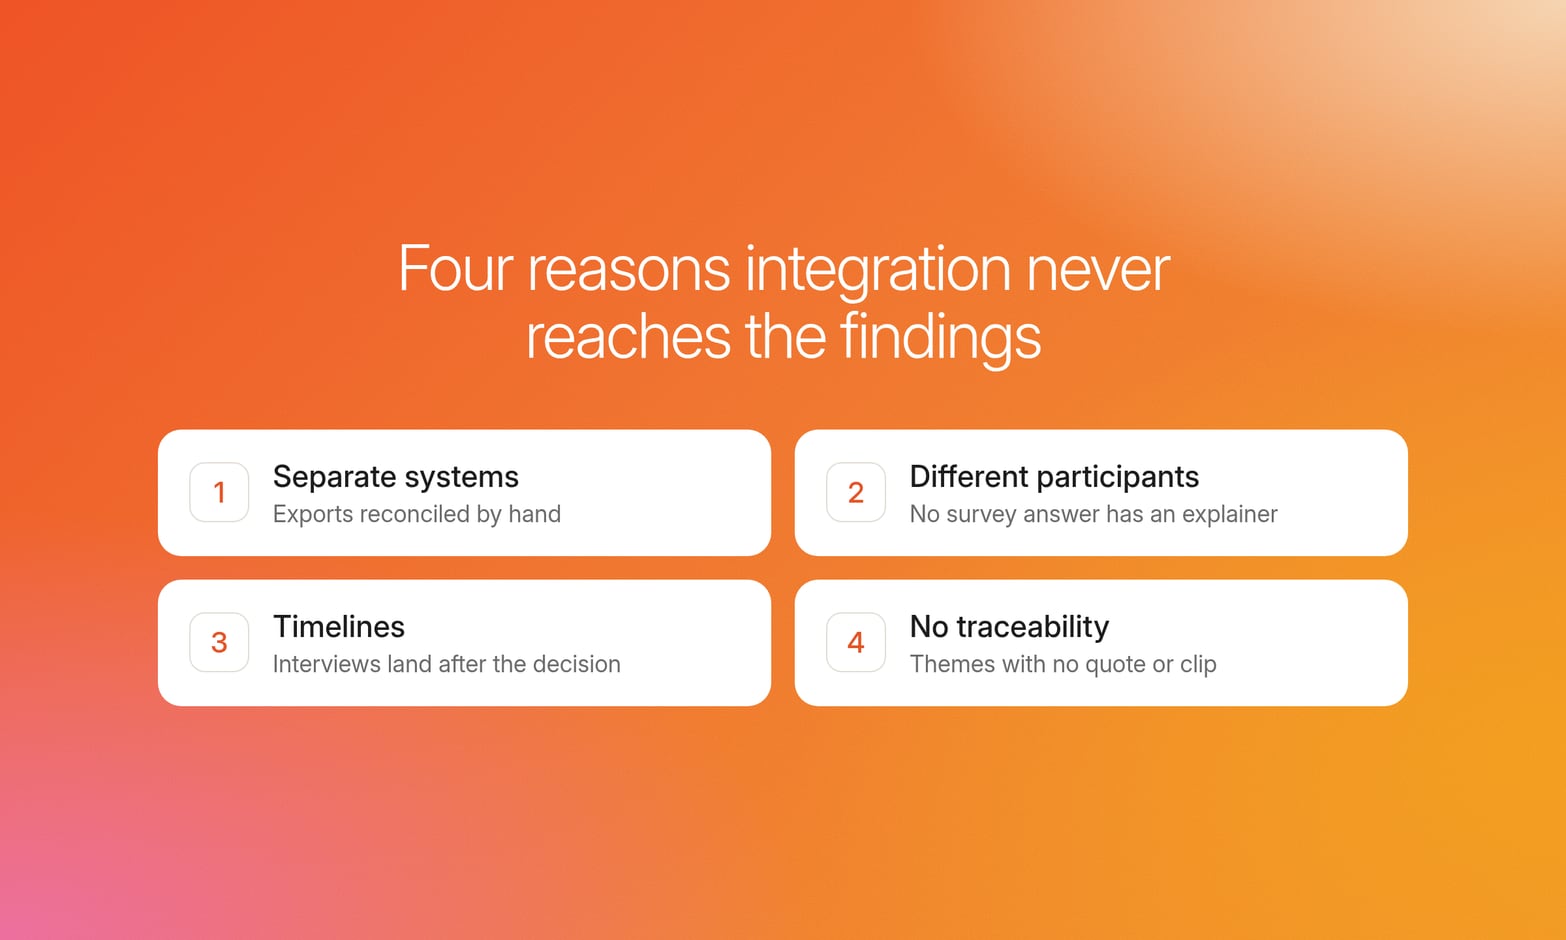
Each is an operational constraint: researchers know the qualitative and quantitative components should connect, but systems, samples, and schedules prevent it.
Insights teams of one to five people often serve marketing, product, and innovation at once. They cannot run enough qualitative research to keep a mixed-methods program current, so requests stack into a backlog while the survey strand keeps running. Every week of backlog is a week of decisions made on the survey alone.
Each failure mode is fixable early in the research process, at data collection, long before anyone opens the report template.
How to integrate qualitative and quantitative evidence in the data
Four practices embed mixed-methods integration into the qualitative and quantitative evidence itself, before a single report slide exists.
1. Define behavioral segment criteria before recruiting
Demographic-only splits, such as women aged 35 to 54, rarely explain decision drivers. Write the mixed methods research questions first, then define segments by the behavior those questions turn on: lapsed buyers, recent switchers, or heavy users of a competing format.
For qualitative methods, 5 to 15 participants per behaviorally defined segment typically reaches data saturation for persona-grade signal. When sizing the sample, the survey needs enough participants per segment to read differences with confidence in the quantitative analysis, and interviews draw depth from the same pool.
2. Collect both strands from the same participants
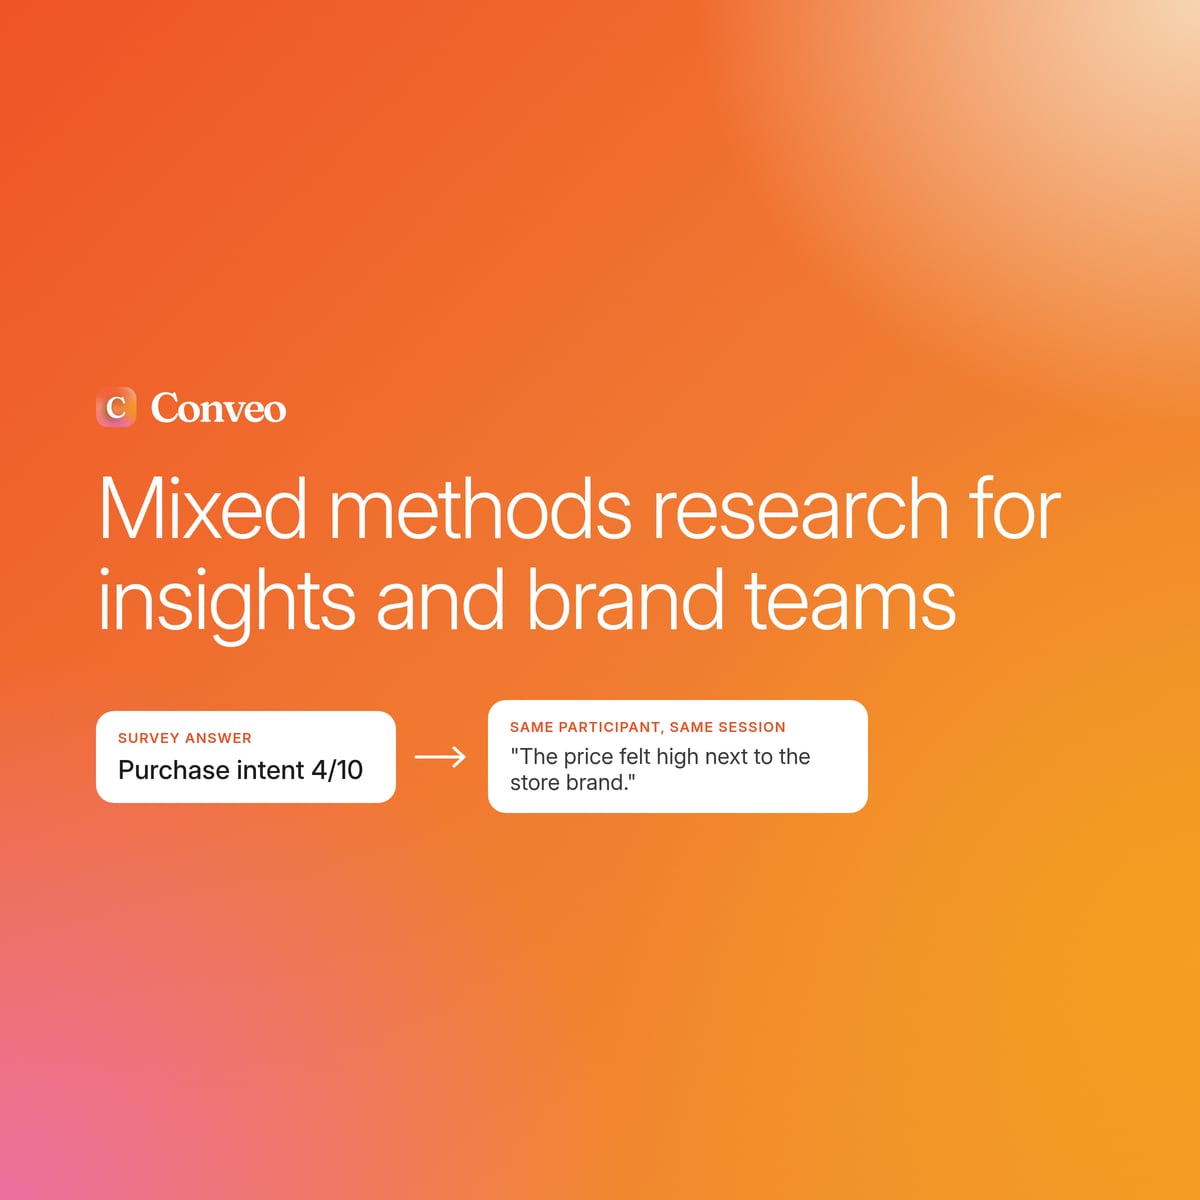
When teams collect data for both strands from one person, that person's own words explain their survey answer. A participant who rates a concept 4 out of 10 can say, in the same session, what made them hesitate.
Divergence then becomes something to investigate instead of a sampling artifact. Segment tags carry across both strands, so every quote arrives filed against the behavior that defined it.
3. Build joint displays
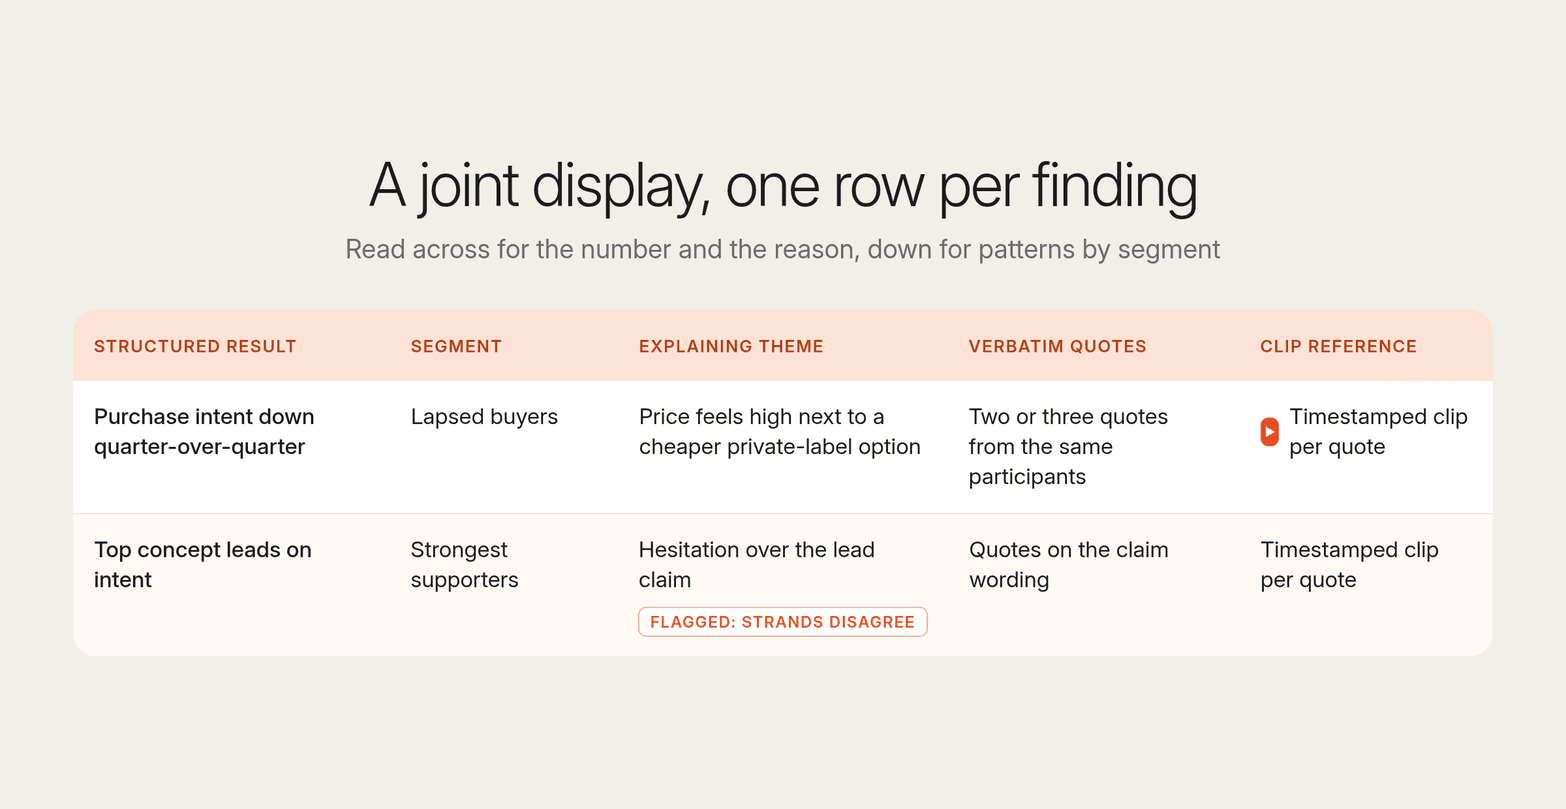
A joint display places each survey result beside the qualitative themes and quotes that explain it, with one row per finding. Stakeholders read across a row and see the number, the reason, and multiple perspectives on the same finding together. A typical layout looks like this:
| Structured result | Segment | Explaining theme | Verbatim quotes | Clip reference |
|---|---|---|---|---|
| Purchase intent down quarter-over-quarter | Lapsed buyers | Price feels high next to a cheaper private-label option | Two or three quotes from the same participants | Timestamped clip per quote |
Reading down the columns helps teams identify patterns across segments. Rows where the strands disagree stay in the table, flagged, because those are often the study's most useful findings.
4. Adopt a traceability convention
Set the rule before fieldwork: every theme from the thematic analysis links to timestamped clips and verbatim quotes, and no claim ships without a source. The convention protects the researcher as much as the finding.
When a stakeholder challenges a conclusion, the answer is a 40-second clip of a participant saying it. Review meetings shift from defending findings to deciding what to do.
Run this way, one program with two strands delivers findings while the decision is still open, where a sequenced cycle often takes several weeks. Three rigor checks stay fixed at either pace:
Segment definition: behavioral criteria are set before recruiting.
Participant authenticity: every participant is a real, screened person.
Traceability: every claim links to a source when analyzing data.
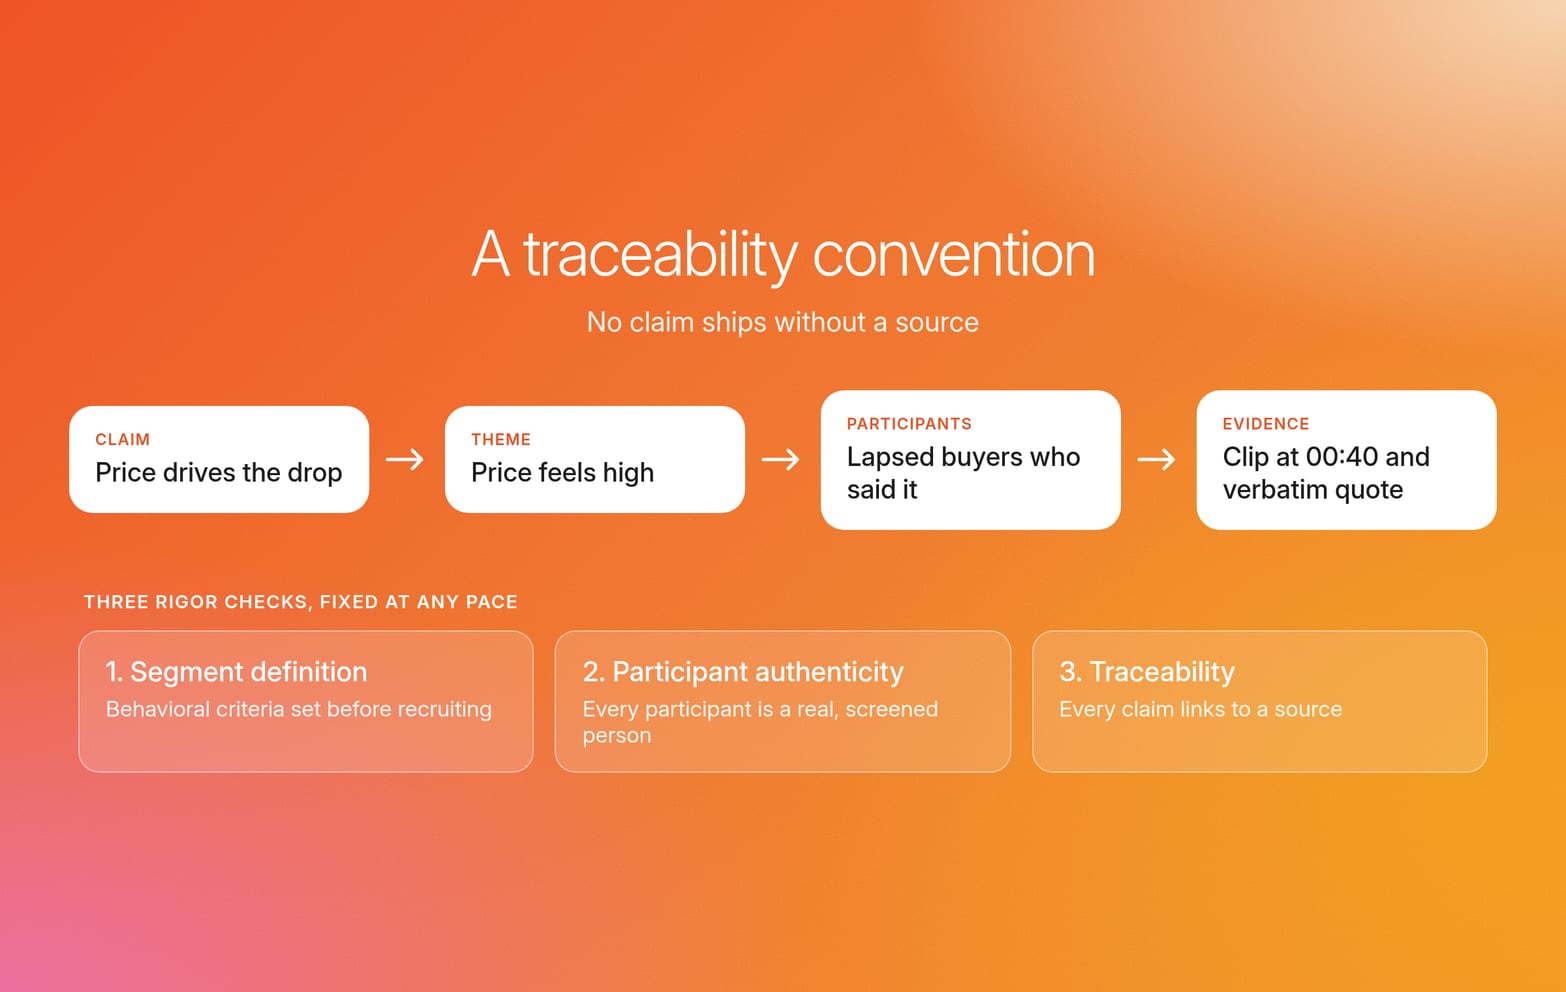
Integration is a set of data-collection and traceability decisions made before fieldwork begins. Researchers who run both strands on Conveo build those data-collection and traceability decisions into study setup.
Mixed methods research examples for commercial teams
Two mixed-methods research examples show how a single mixed-methods study answers both a "how many" and a "why," with the same participants supplying both. The following are representative scenarios illustrating how integrated evidence changes a call, not reported results from a named customer.
1. Concept testing
Decision: which of three snack concepts moves into development.
Structured strand: a survey ranks the concepts on appeal, uniqueness, and purchase intent.
Interview strand: AI-moderated interviews with the same participants probe hesitation and capture the words they use for each concept.
Integrated finding: the top-ranked concept wins on intent, but its strongest supporters hesitate over the lead claim. The team rewrites the claim in participants' own language and retests before development.
2. Brand perception
Decision: whether to extend a campaign into the next quarter.
Structured strand: rating and single- or multi-select questions inside the video conversation show consideration rising among recent category switchers after launch.
Interview strand: the follow-up "why" in the same conversation captures why equity moved and what each switcher noticed first.
Integrated finding: participants credit a packaging change more than the campaign message. The team extends the campaign and moves the packaging cue into the creative.
In both, the decision changed because the quantitative evidence and the qualitative findings came from the same people. Our guide to concept testing covers the setup.
Conveo compared with agencies, stitched tool stacks, and synthetic AI
Four ways to run a mixed-methods program differ on what determines quality: where integration happens.
| Criterion | Agency-led research | Stitched multi-tool stack | Synthetic or generic AI | Conveo |
|---|---|---|---|---|
| Where integration happens | In the final report, with senior moderator judgment behind it | By hand across exports, under the team's control | Inside a model, unverifiable | In the data, per participant |
| Participants | Real, recruited per study | Real, often different per strand | No real participants | Real, same people across strands |
| Time to findings | Weeks per cycle | Weeks, gated by reconciliation | Minutes, without real evidence | Fielding in days (100 interviews in 3 days) |
| Traceability | Held in agency deliverables | Breaks between systems | No source to trace | Every theme to clip and quote |
| What the team supplies | Design and synthesis bought in | Method freedom at each step | Prompting only | A researcher to define segments and interpret |
Agencies remain a strong choice for complex, high-stakes studies, and they provide design capacity that a one-person insights function lacks. The constraint is cadence and cost on iterative refreshes.
Stitched stacks give teams control over each step, and for unusual method requirements, that control is the right trade-off, though reconciling quantitative datasets with transcripts still falls to the researcher.
Synthetic or generic AI answers fast, but the choice between synthetic respondents vs real participants decides whether anyone can tell a stakeholder who said it.
Conveo extends research capacity alongside agency work: research you could not run before at agency scale.
With both strands in one program, fielding can run at 100 interviews in 3 days, so findings arrive while the decision is still open.
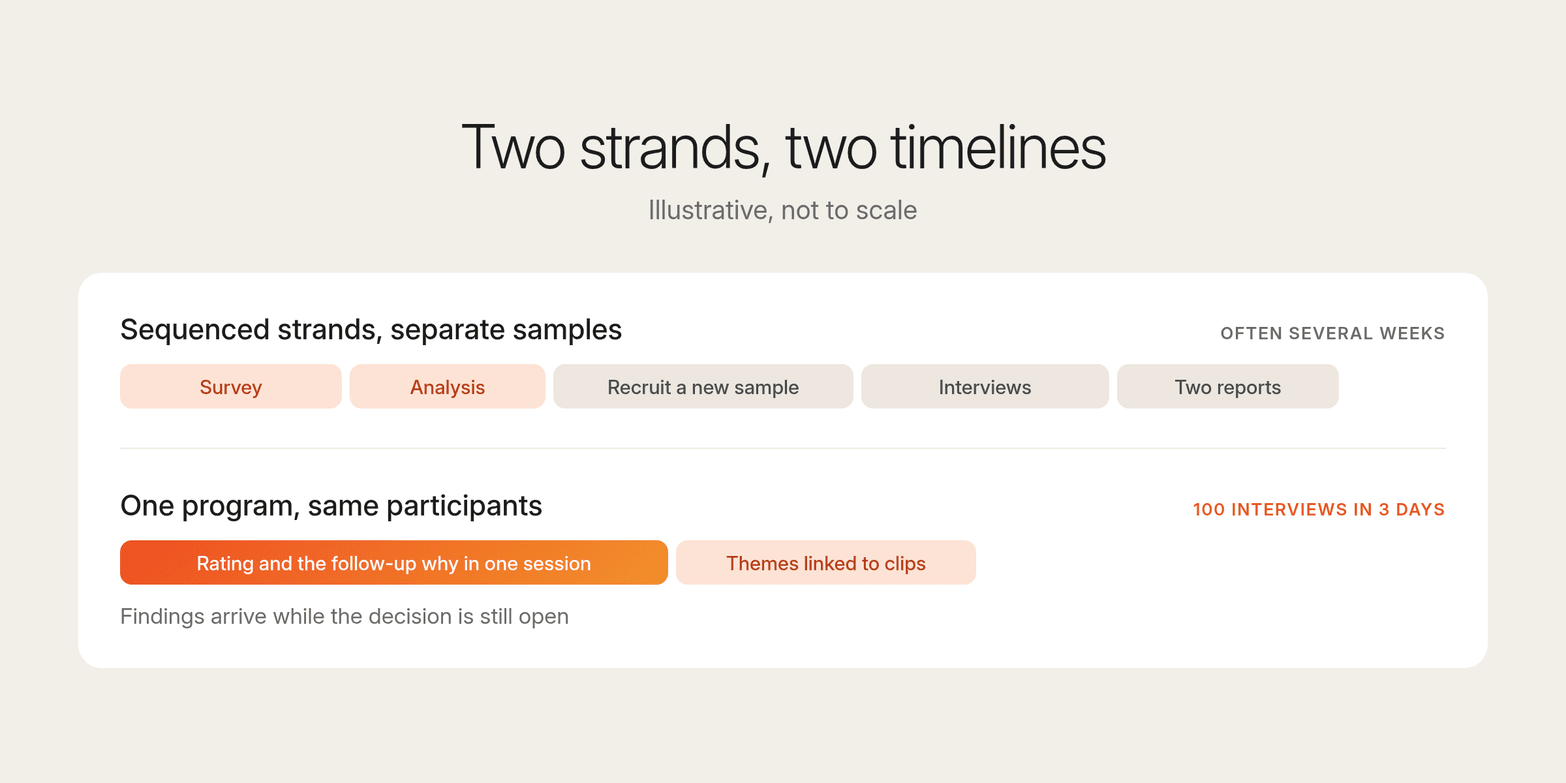
Choose by where integration happens, because that decides whether findings are traceable.
How Conveo runs mixed methods research in one program
Researchers use Conveo to run mixed-methods research in one program and keep a current read on the questions stakeholders keep asking, instead of waiting for the next commissioned study. They collect quantitative and qualitative data from the same participants, so the number and the reason arrive together. That removes operational work: the scheduling, translation, and reconciliation that consume the weeks of analysis needed when quantitative and qualitative approaches run apart.
"Conveo has definitely changed what we can pitch to clients, because it allows us to bridge the gaps between quantitative and qualitative methodologies and tell a more complete end-to-end story. It lets us close the loop: from the archetypes we've identified in the qualitative, which of them actually resonate the most? It feels more authoritative, more backed up by the data."
Fergus Navaratnam-Blair, VP Trends and Futures, National Research Group (NRG)
The researcher designs the study and interprets the findings, while Conveo's AI research assistant supports them during fieldwork.
Researchers clear scheduling drag by running AI-moderated voice and video interviews in parallel across markets and time zones, for example, 100 interviews in 3 days.
Multi-country programs avoid localization delays by running studies in 50+ languages with Conveo's AI research assistant.
Researchers keep the context that text notes and surveys miss by capturing voice, video, and tone.
Both strands share segment criteria, whether teams recruit through 8 integrated panel providers or their own participant list.
Traceability. Each theme links to the participants behind it, with video clips and verbatim quotes stakeholders can audit, so anyone in a review can open a theme and watch the participant say it. For a VP of marketing, that is launch-risk management: a go-or-no-go call costs less to defend when the evidence is auditable, and media money stops going behind a claim customers never endorsed.
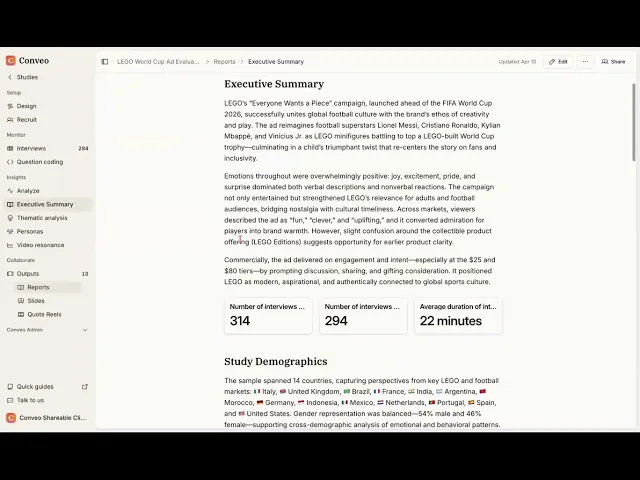
Compounding waves. Studies recognize recurring themes and facets across a searchable insight library, so the next wave builds on what earlier ones established instead of starting with a blank codebook. Conveo StoryLines is a continuous, wave-based program of AI-moderated video conversations, so the team re-reads a concept or perception question as the market moves. Teams run the same mixed methods project as recurring waves, for example every two weeks or monthly.
Governance. Research-grade means the method is visible, every finding traces to a real person, and teams build an audit trail into the process. Procurement reviews clear early because the platform is SOC 2 Type II certified, ISO 27001:2022 certified, and GDPR compliant, with EU hosting (Belgium).
Enterprise insights teams at Google, AB InBev, Kellanova, General Mills, JDE Peet's, and Canva rely on Conveo to understand their consumers.
Frequently asked questions
What sample size does a mixed methods research study need?
Plan 5 to 15 participants per behaviorally defined segment for the qualitative strand. The quantitative strand needs enough per segment to support statistical analysis, so sizing follows segment count, not one overall total.
How long does mixed methods research take?
In a sequential explanatory design, a program that recruits separately for each strand often runs several weeks, because qualitative data collection cannot start until the quantitative research happens and gets analyzed. When both strands come from the same participants in the same session, findings arrive while the decision is still open.
How is mixed methods research different from running a survey plus separate interviews?
Running both and reporting them in one deck puts quantitative and qualitative methods side by side, which is multimethod collection. Conducting mixed methods research means a survey result can be explained by a participant's own words, with a quote or clip behind it. That link exists only when the same people supply both.
What drives the cost of a mixed methods program?
The cost of a mixed methods program is driven by segment count, incidence rate in recruitment, markets and languages in scope, and how much moderation and synthesis of the qualitative components is bought in. Running qualitative and quantitative data collection in one program removes the duplicate recruitment cost of fielding two studies.
Does an in-house mixed methods program remove the need for agency work?
No. Agency teams remain a strong fit for complex, high-stakes quantitative and qualitative research and for design capacity a small insights function cannot staff. An in-house program covers the iterative questions that cannot wait for a commissioned cycle. Most teams run both.

About the author
Florian Hendrickx
Head of Growth
Florian is Conveo’s Chief Growth Officer, leading growth strategy and go-to-market execution as the company scales. He’s held growth leadership roles at companies like Deliverect, Robovision, and Aikido Security, and brings hands-on experience across marketing, sales, and product.
More by Florian →Qualitative insights at the speed of your business.
Conveo runs AI-moderated video interviews and structures everything they say.