In this article
TL;DR
Qualitative data analysis methods are structured ways of turning interviews, focus groups, and other non-numerical data into findings. The study's question should drive method choice, because habit-driven methods produce findings that look rigorous but answer the wrong question.
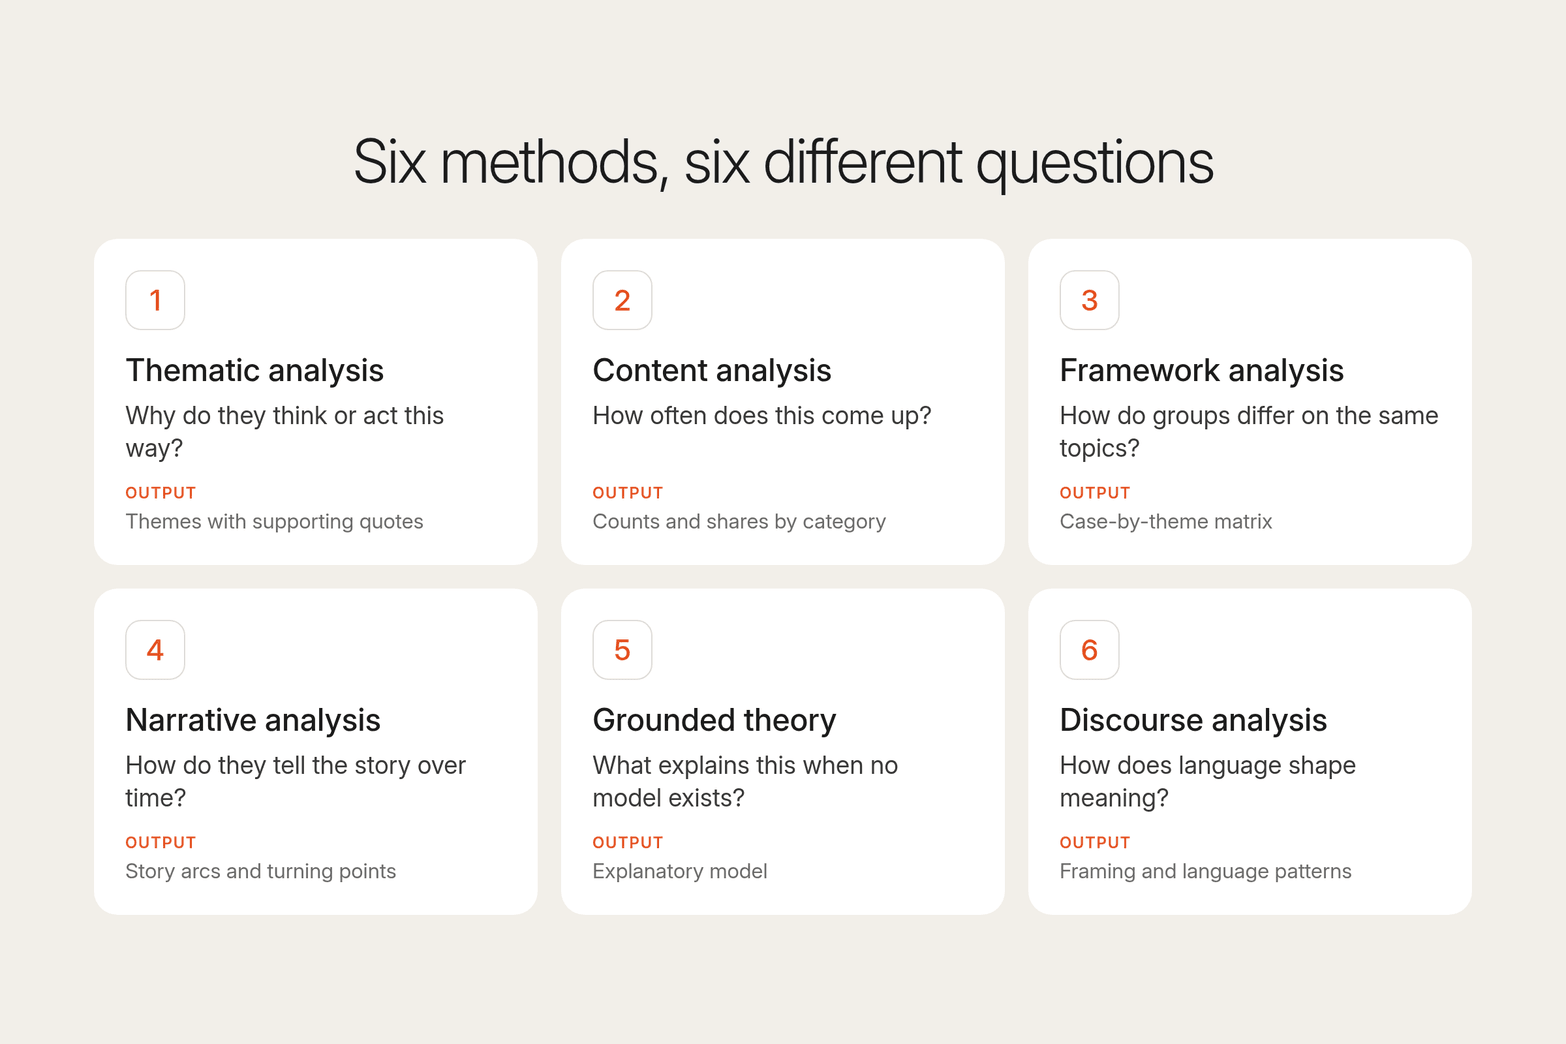
Methods: Six approaches cover most enterprise studies: thematic analysis, content analysis, framework analysis, narrative analysis, grounded theory, and discourse analysis.
Match rule: Use content analysis for comparable counts from a stable codebook, and thematic analysis to explain meaning and decision drivers.
Sequence: Run thematic analysis to identify themes, then turn validated themes into a fixed codebook for content analysis to measure prevalence.
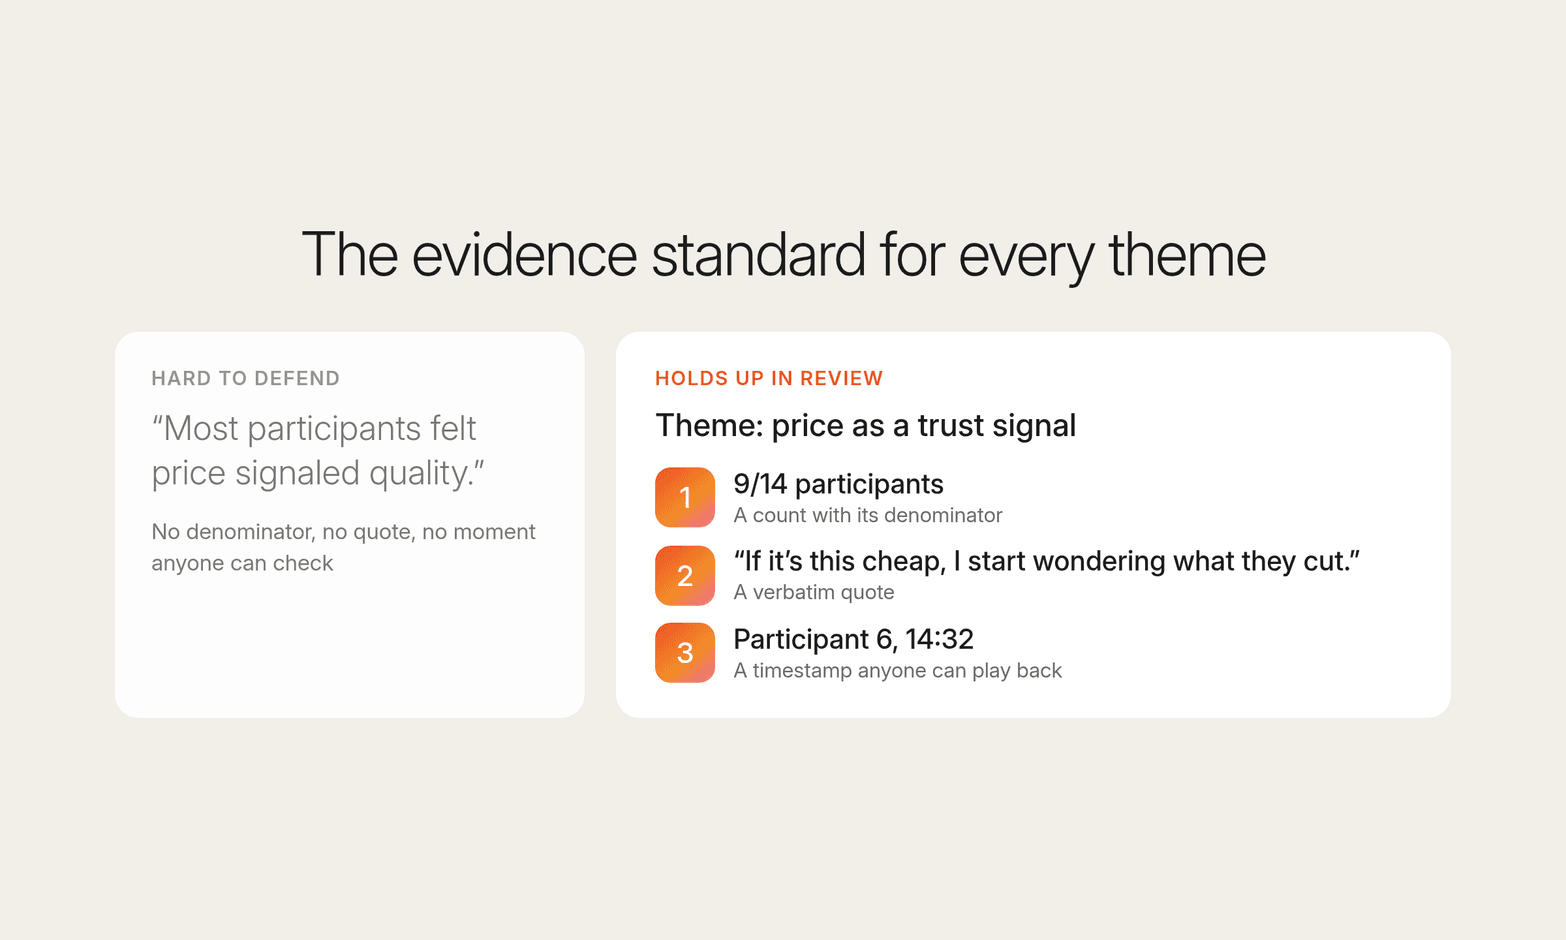
Evidence standard: Link every theme to verbatim quotes and timestamps, and report counts such as 9/14 participants instead of "most participants."
Most teams choose among qualitative data analysis methods before they have read the research question closely.
Picture the readout. An insights team presents six themes on why shoppers lapsed, the brand director asks how many of the 20 participants raised each one, and nobody can answer. The team reopens the interview transcripts, and the revised version lands three weeks later, after the relaunch call.
Most qualitative researchers could name the right analysis method. The team used thematic analysis out of habit, on a question about prevalence. The harder failure to catch is a finding that looks rigorous and is wrong, because themes arrive as slide summaries with no codebook or timestamped evidence behind them.
Qualitative data analysis turns raw conversation data into findings you can trace back to evidence. This guide covers six ways to analyze qualitative data, a selection framework built on question type, data type, and constraints, and a workflow that keeps one body of conversations open to more than one method.
What qualitative data analysis methods actually are, and how they differ
Qualitative data analysis methods are structured ways of turning unstructured, non-numerical data, such as interviews, focus groups, diaries, and open-ended responses, into findings. Each sets rules for coding, grouping, and interpreting data, so two analysts working from the same interview transcripts can reach the same conclusion.
Where quantitative research applies statistical methods to numerical data to measure how much, qualitative research focuses on meaning: why participants act and what a word signals to them. The raw material is textual or visual data, from open-ended answers to video of a participant hesitating.
Analysis is a separate decision from collecting data. Qualitative research methods such as interviews and diaries shape what participants are asked, and analysis determines what you can claim from the collected data. In real studies, the two loop, as early interviews surface emerging patterns that later interviews probe, so analyzing data only after fieldwork closes wastes that loop.
Methods differ along three dimensions:
The question they answer: why people act, how often something occurs, or how groups compare.
The structure they impose up front: a fixed codebook, or categories that emerge from the raw data.
The claim they support: meaning for interpretive methods, prevalence for counting methods.
Inductive analysis builds codes from the data itself. Deductive analysis applies codes defined in advance, usually from a hypothesis or the research objectives, so results compare across studies. Most methods sit between the two, and what matters is choosing a qualitative data analysis approach on purpose and writing it down.
The method determines the claim you can defend, so choose it before the first transcript gets coded.
6 types of qualitative data analysis methods at a glance
These six methods are the ones most enterprise teams use to analyze qualitative data in market research and UX studies. The table compares them side by side, including where each one breaks.
| Method | Question it answers | Structure before analysis | Output | Main risk |
|---|---|---|---|---|
| Thematic analysis | Why do they think or act this way? | Low, codes emerge from data | Themes with supporting quotes | Overstating prevalence |
| Content analysis | How often does this come up? | High, fixed codebook | Counts and shares by category | Missing new categories |
| Framework analysis | How do groups differ on the same topics? | Medium to high, predefined topics | Case-by-theme matrix | Forcing data into the grid |
| Narrative analysis | How do they tell the story over time? | Low, focus on sequence | Story arcs and turning points | Hard to generalize |
| Grounded theory | What explains this when no model exists? | Minimal, iterative coding | Explanatory model | Slow, documentation gaps |
| Discourse analysis | How does language shape meaning? | Low to medium, linguistic focus | Framing and language patterns | Reading talk as belief |
The most common mismatch is applying thematic analysis to data that calls for framework or narrative analysis, and it only shows up when a stakeholder asks a comparative or sequential question. Ask whether the question compares groups, follows a sequence, or explains a motive to narrow the appropriate methods.
Thematic analysis: explaining meaning and decision drivers
Thematic analysis identifies patterns of meaning across qualitative data, then organizes and interprets them. It answers "what does this mean to participants, and why do they act on it?"
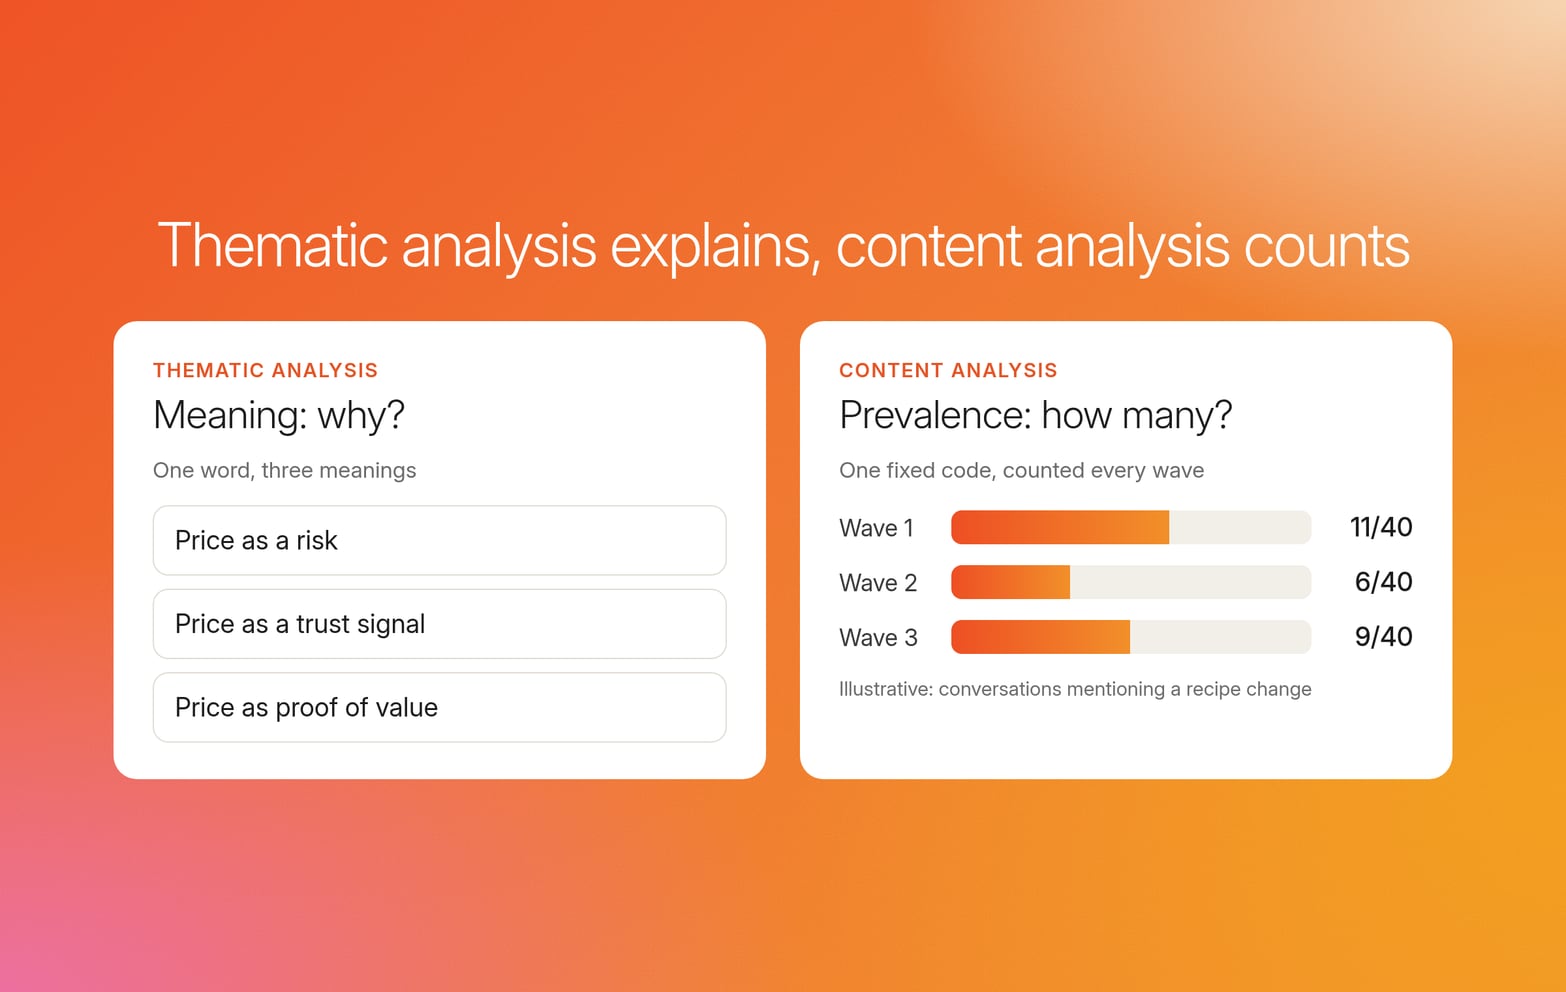
Take "price." One participant mentions it as a risk, another as a trust signal, and a third as proof of value. A keyword count treats all three as one mention, and thematic analysis separates them.
The six-step process
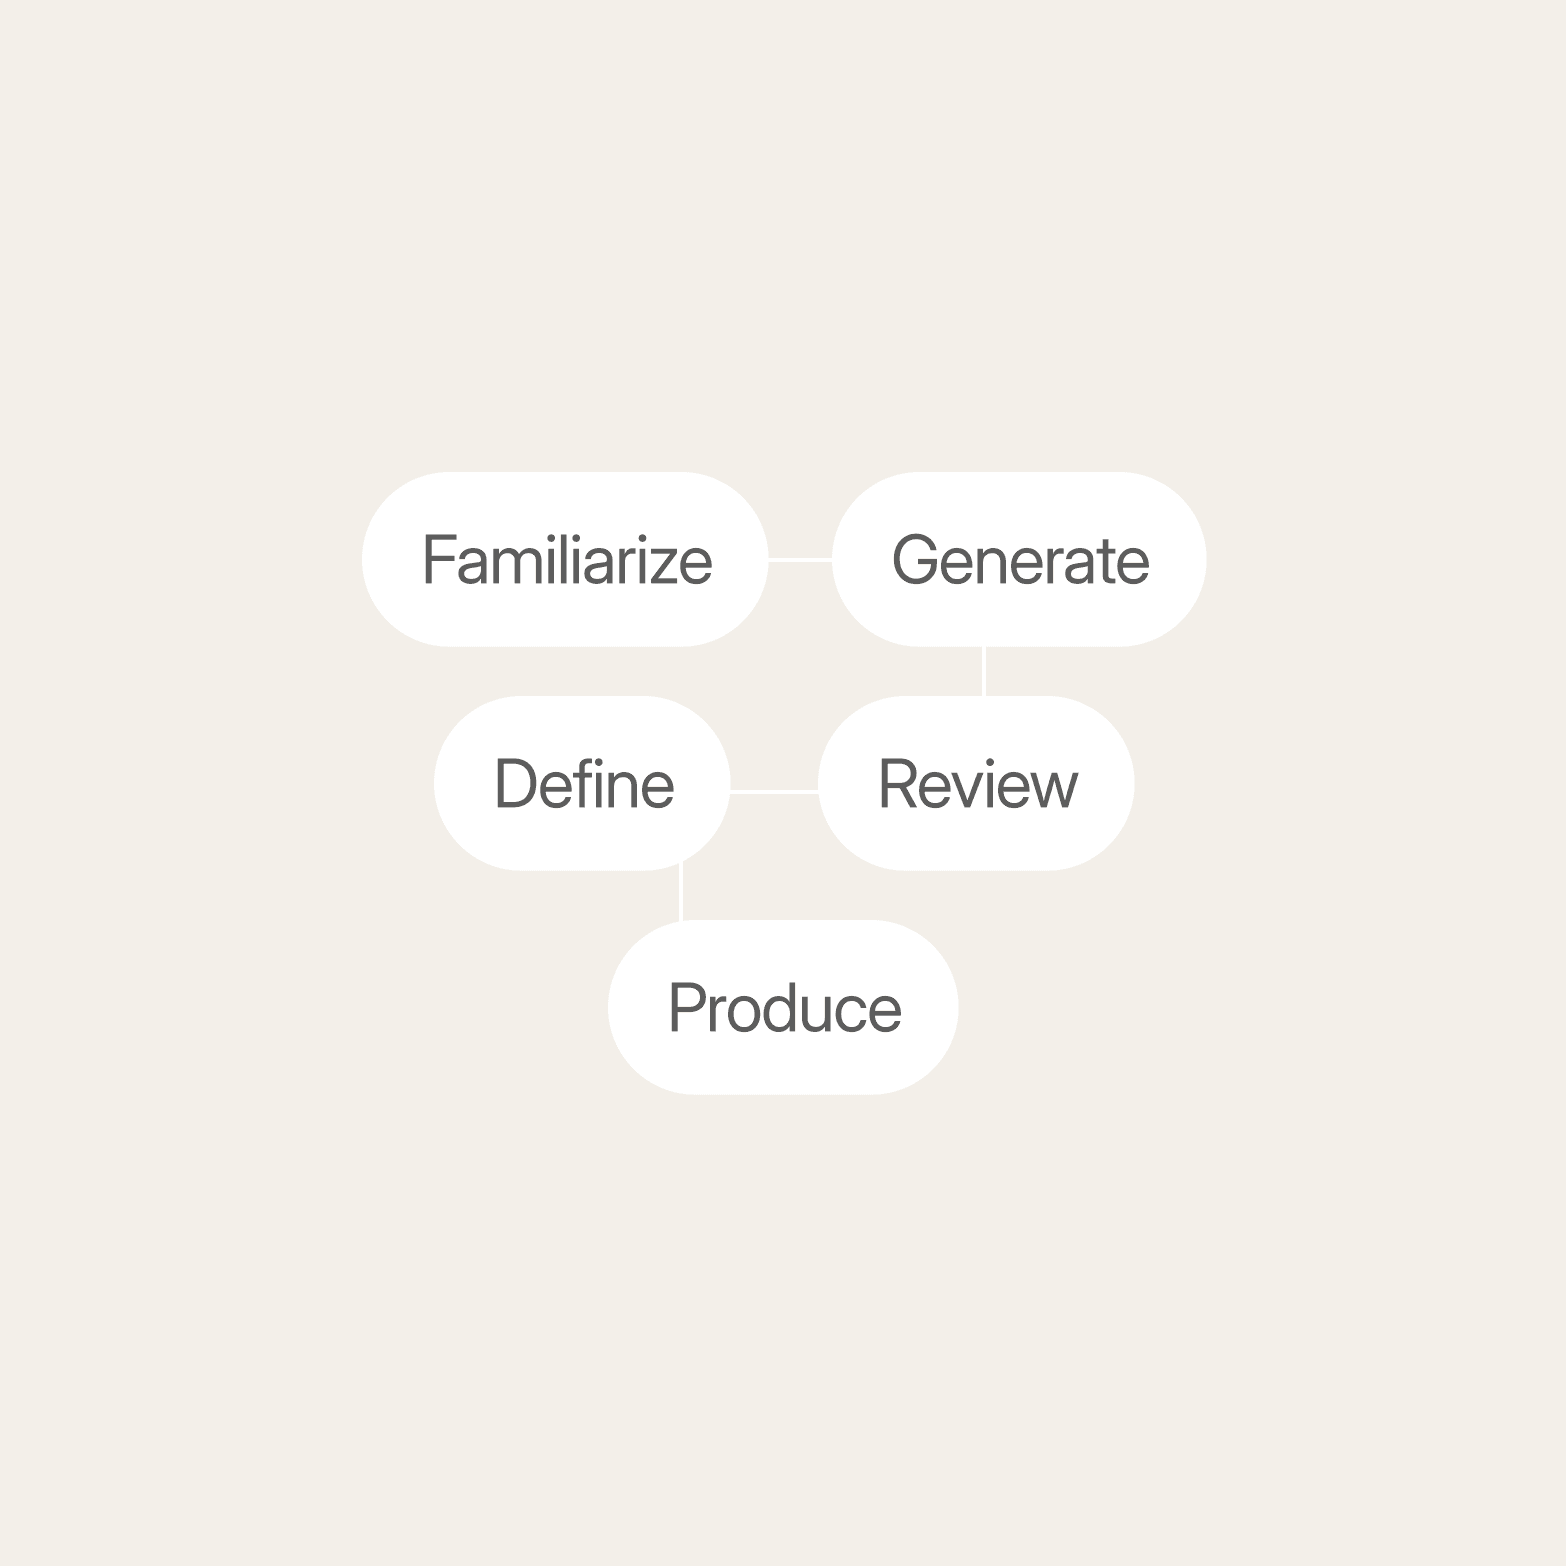
The thematic version of the qualitative data analysis process follows Braun and Clarke's six phases, whether the team relies on manual coding or qualitative data analysis software:
Familiarization: Read or watch every conversation in full before coding.
Initial codes: Tag short segments with descriptive labels.
Theme development: Group related codes into broader categories that become candidate themes.
Review: Check each candidate theme against the full data set and split, merge, or drop it.
Definition: Name each theme and state what it includes and excludes.
Write-up: Report each theme with its participant count, verbatim quotes, and timestamps.
Negative case analysis, the rigor step most teams skip in qualitative analysis, means intentionally searching for participants who contradict a theme. It stops teams from overstating research findings stakeholders will challenge.
The limit: prevalence
Thematic analysis does not produce reliable counts. One talkative participant can supply five supporting quotes, and the coding process shifts as themes develop, so "the theme appeared in 30 excerpts" measures how much people talked, which makes it a weak stand-in for quantitative analysis. The evidence standard closes the prevalence gap in thematic analysis. A hypothetical example:
Theme: Price as a trust signal. 9/14 participants described a low price as a reason to doubt quality.
"If it's this cheap, I start wondering what they cut." (Participant 6, 14:32)
Compared with "most participants felt price signaled quality," this version gives a denominator, a verbatim quote, and a moment anyone can check.
What video adds
Video adds audio and visual data that transcripts lose. A pause, a tone shift, or visible confusion at a pricing screen can turn apparent agreement into reluctance, and interpreting qualitative data means following what the participant meant. Teams running AI-moderated interviews on Conveo code with that signal in view, because analysis covers speech, tone, and facial cues alongside the transcript.
"Consumers did a live unboxing for us: seeing it for the first time, giving us their first reactions. They don't have time to rationalize. It's all emotive, in that moment."
Dafydd Jones, Associate Director, Ninth Seat
Thematic analysis is the most flexible of the six methods, which is why qualitative researchers default to it and why it needs negative cases and participant counts to hold up.
Decision rule: Choose thematic analysis when the question is "why" or "what does this mean to them."
Content analysis: measuring prevalence with a stable codebook
Content analysis applies a predefined codebook to qualitative data to produce comparable counts. It answers "how many participants raised this, and has that share changed?"
Use it for comparable counts across time, segments, or touchpoints. It is the method stakeholders most often want in a dashboard next to quantitative data.
Keep the codebook stable
Each category in a content analysis codebook needs a definition, inclusion rules, exclusion rules, and an example quote. Two failures follow when the codebook drifts or ages:
Drift: If categories shift partway through the research process, counts from before and after stop being comparable. Recode the full data set or start a new series.
Blind spots: Content analysis only finds what the codebook names, so a new complaint gets coded as "other" or forced into the closest of the broader categories. A growing "other" share signals emerging patterns slipping past the codebook.
Qualitative vs. quantitative content analysis
Quantitative content analysis works like any quantitative data analysis: it turns coded data into frequencies and tests for change with statistical methods.
Qualitative content analysis keeps the coded segments in view, so each count comes with the quotes behind it.
Worked example: tracking a recipe change
In this hypothetical example, a consumer insights lead tracks the share of conversations that mention a recipe change, defined as any comment that the product tastes or feels different from before.
Wave 1: 11/40 conversations mention it, mostly saying it tastes sweeter.
Wave 2: After a reformulation, 6/40 mention it.
Wave 3: 9/40 mention it, and the "other" share rises as participants describe a new pack that is hard to reseal.
Read as three data points, the counts suggest the reformulation worked and something new broke, so the team adds a pack category before wave 4. Version and date the codebook as part of your data management so the trend line stays comparable.
Decision rule: Choose content analysis when the question is "how many" or "has it changed."
Framework analysis: structured comparison across cases
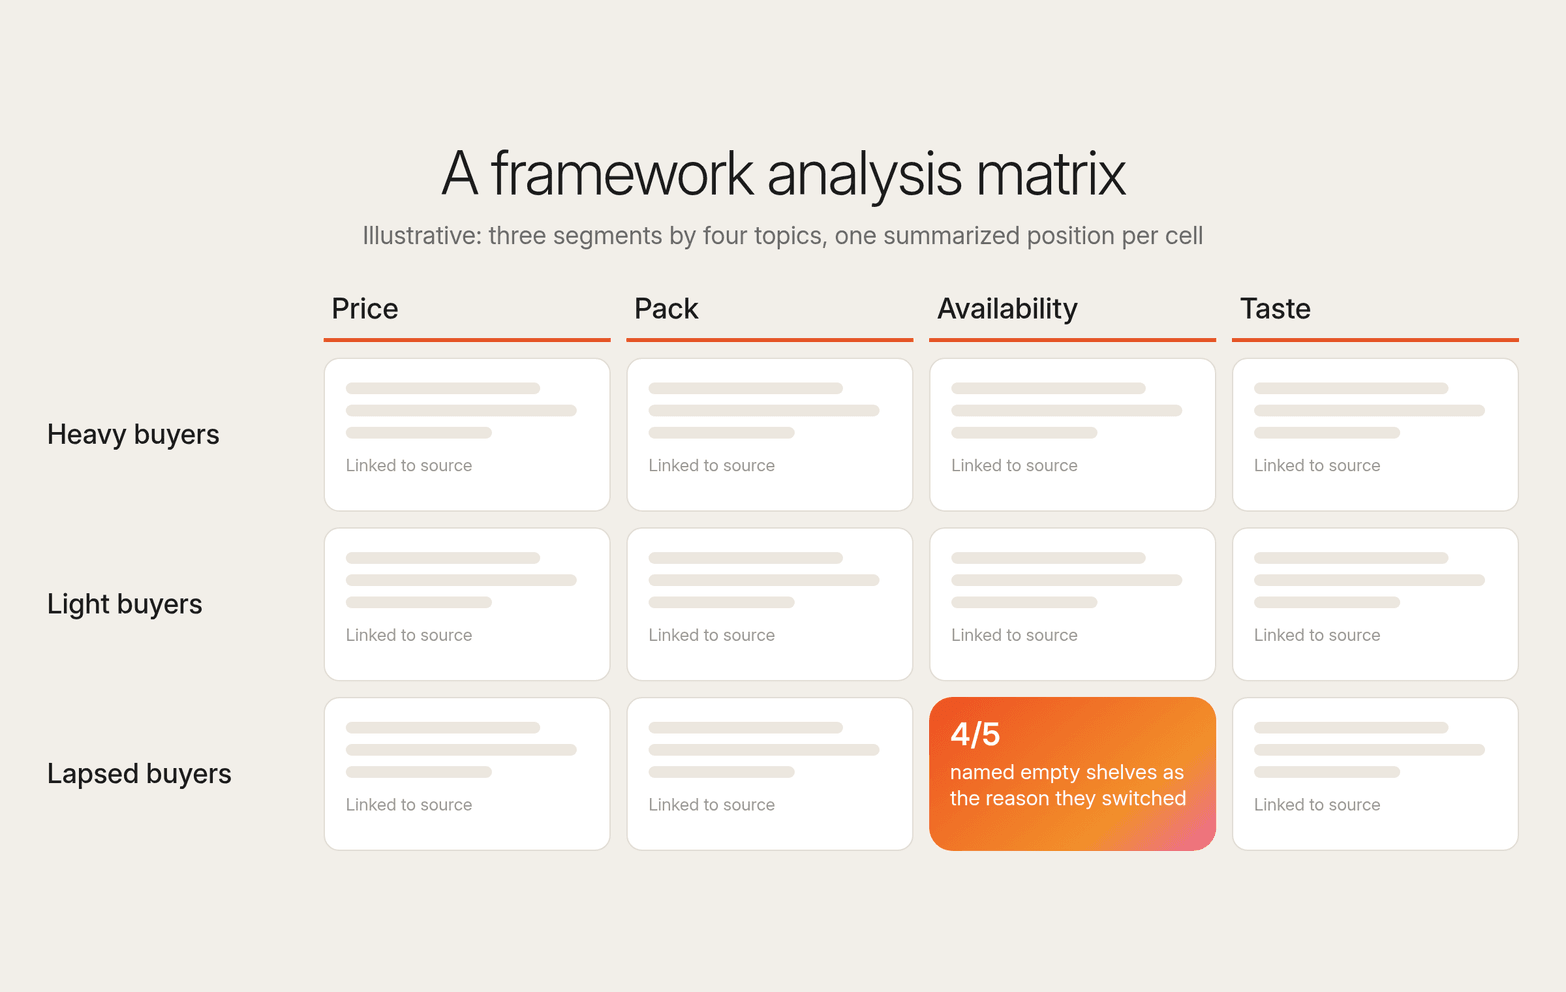
The framework method for qualitative data analysis, developed by Jane Ritchie and Liz Spencer for applied policy research in the UK, organizes findings into a case-by-theme matrix. Each row is a participant or segment, each column is a topic, and each cell holds a summarized position linked to its source. Topics usually come from the research objectives, and gaps show up as empty cells.
Use framework analysis for:
Applied research with predefined research aims
Multi-segment comparison
Stakeholder questions that map to a known structure
For enterprise teams, the value is cross-functional reporting: each function reads its own column, and whoever picks up the research project next can see the structure.
Worked example: three segments, four topics
A hypothetical framework analysis compares heavy, light, and lapsed buyers across price, pack, availability, and taste, giving 12 cells, each summarizing data from one segment on one topic. The cell for lapsed buyers on availability reads:
Lapsed buyers, availability: Stopped finding it at their usual store. 4/5 named empty shelves as the reason they switched.
"It just wasn't there the last few times, so I grabbed something else." (Participant 11, 08:15)
A team reading only pooled themes would see price as the top concern and test a discount. The matrix shows that for lapsed buyers, the real lever is availability. Keep each cell close to what participants said to keep data interpretation traceable.
Decision rule: Choose framework analysis when the question is "how do these groups differ on the same topics."
Narrative analysis, grounded theory, and discourse analysis
These three methods address narrower questions and come from the academic social sciences, so applied teams often skip them out of habit.
Narrative analysis: how participants tell the story
Narrative analysis examines how participants structure their accounts over time: what comes first, what changes, and what they treat as the turning point.
Best for: Journey research, adoption stories, and moments of change.
Habit error: Coding a journey into themes such as "frustration" and "cost" loses the arc. The team learns that frustration mattered but misses that it peaked in week two, right before the participant almost quit.
Decision rule: Choose narrative analysis when the order of events carries the meaning.
Grounded theory: building explanation from the data
Grounded theory, first set out by sociologists Barney Glaser and Anselm Strauss in 1967, is a method built for theory development: it builds an explanatory model directly from data through iterative coding and constant comparison.
Best for: Exploratory investigations with no established framework. Analysts compare each new piece of data against existing codes until new data stops adding meaningful insights.
How the loop works: Grounded theory is the most iterative process of the six. Analysts code the first interviews, form tentative categories, and use theoretical sampling to choose the next participants, making it the clearest collection-analysis loop in the qualitative research process.
Cost: It is slower than the other five methods and requires memos that record every coding decision. Without them, nobody can trace the qualitative analysis process from interviews to explanation.
Discourse analysis: how language does work
Rooted in the social sciences and linguistics, discourse analysis examines how language constructs meaning, positions people, and shapes social reality.
Best for: Framing, brand language, message testing, and market research on categories where vocabulary is shifting.
Strongest source: Focus group discussions, where participants negotiate language in real time.
Boundary: It answers questions about language and cannot tell you what participants believe or will do.
How to choose among qualitative data analysis methods
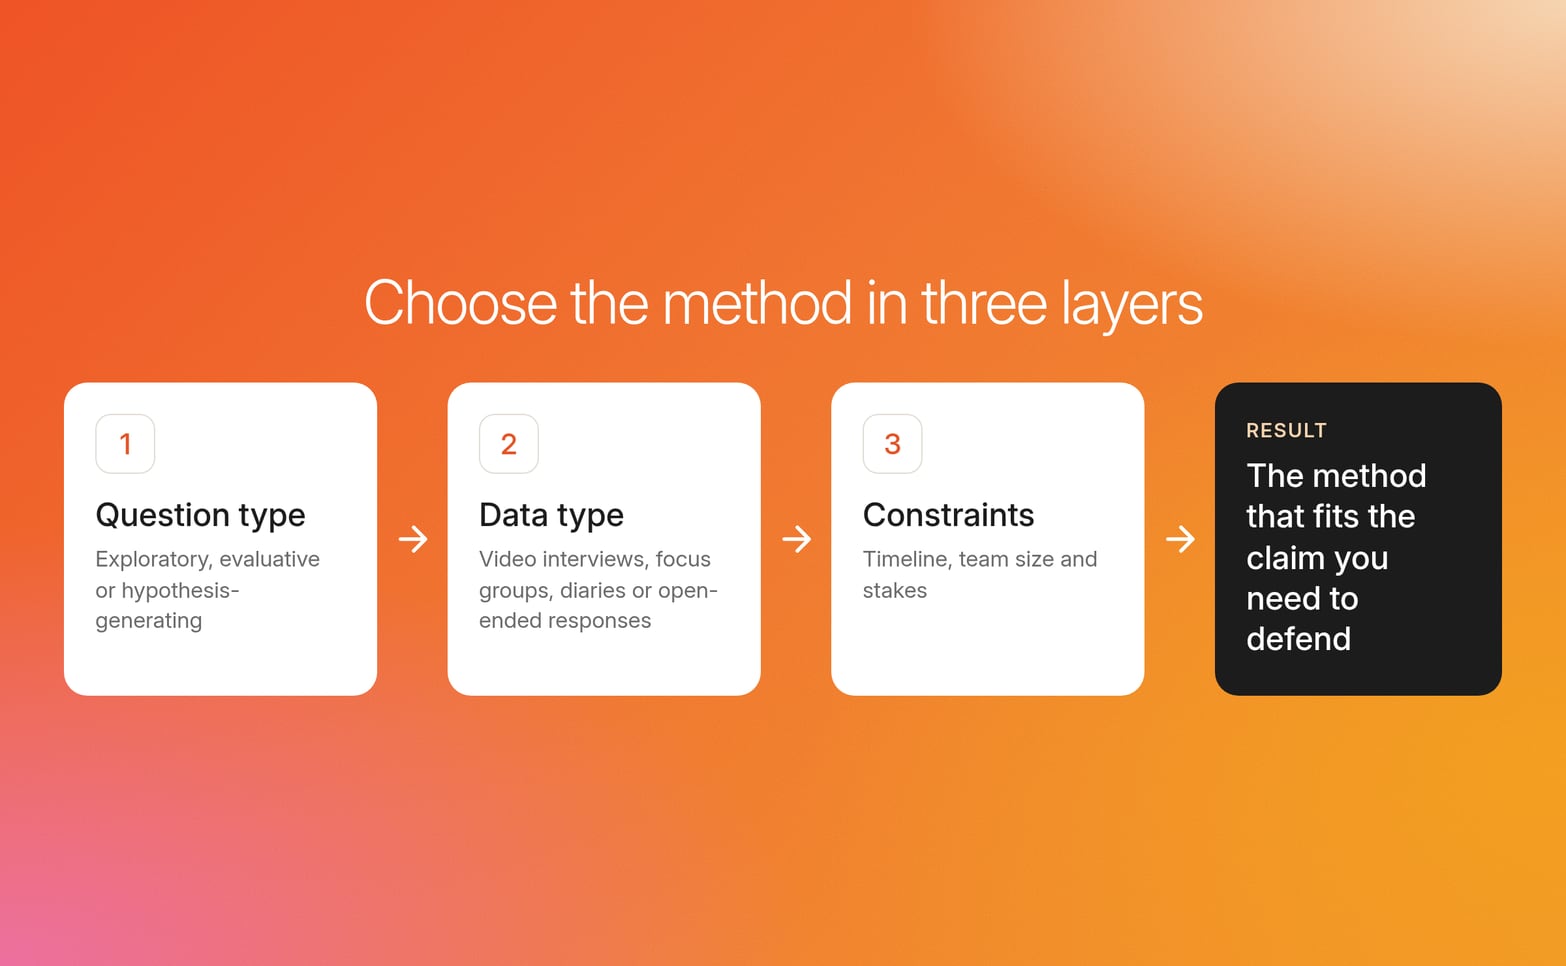
Method selection starts from the question type, then the data type, then the constraints. Each layer narrows the options toward the right analysis method.
Layer one: question type
| Question type | Example | Best-fit methods |
|---|---|---|
| Exploratory | "What is going on here?" | Thematic analysis to identify patterns, or narrative analysis when the answer depends on sequence |
| Evaluative | "Did it work, and for whom?" | Content analysis for change over time, or framework analysis for comparison across segments |
| Hypothesis-generating | "What might explain this?" | Grounded theory for theory development, or discourse analysis when the hypothesis concerns language |
Layer two: data type
| Data type | Best-fit methods | Why |
|---|---|---|
| Video interviews | Any method | Tone and expression add visual data a transcript cannot carry |
| Focus group discussions | Thematic and discourse analysis | Counts per participant are weak, because dominant voices inflate mentions |
| Diaries | The narrative analysis method and grounded theory | Entries arrive over time and show change |
| Open-ended survey responses | Content analysis | Answers are usually short textual data, too thin for narrative or discourse analysis |
Layer three: constraints
Timeline: Name the decision window before the research project starts. As a rule of thumb, a decision due in under two weeks suits content or framework analysis on a predefined structure, and grounded theory usually needs six weeks or more.
Team size: A single analyst often finds framework analysis easiest to keep auditable. Several coders need a fixed codebook and an agreement check before combining coded data.
Stakes: High-stakes decisions need participant counts, negative cases, a second reviewer, and quantitative analysis when population-level numbers matter.
Sequence methods on one data set
Most methods work better in sequence. This pairing answers meaning and prevalence from the same conversations, giving stakeholders a comprehensive understanding of both:
Run thematic analysis on the first wave of conversations to identify themes.
Validate each theme with negative case analysis and a second reviewer.
Convert validated themes into a fixed codebook.
Apply the codebook through content analysis across the full data set and later waves.
This sequence works only if the original conversations stay searchable, making data management part of the method. Researchers add their codes as facets and Conveo extracts them across every interview in the study and in later waves, so every analyst works from the same list.
Prevent mismatch with a selection record
Mismatch means rework. Content analysis on an interpretive question gives counts nobody can explain, and thematic analysis on a prevalence question gives themes nobody can size. Before the qualitative data analysis process starts, write down:
The research aims
The question type and data type
The constraints
The chosen qualitative data analysis approach
The claim it will support
Choosing a method is a decision about which claim you need to defend, so make it before fieldwork closes.
Keep one body of conversations open to every method
Choose among qualitative data analysis methods by the question in front of you: thematic analysis for "why," content analysis for "how many," and framework analysis for comparing groups. When a study needs meaning and prevalence, run different methods in sequence. Hold every research finding to the same standard: a participant count, a verbatim quote, and a timestamp.
That standard is hardest to keep when each new question means new fieldwork. Teams using Conveo run AI-moderated interviews in 50+ languages into one body of conversations that stays open to every method. Recurring themes and facets are recognized across studies in a searchable insight library.
When a stakeholder asks for the source, the team plays it: each theme links to the participants behind it, with video clips and verbatim quotes stakeholders can audit. Procurement can review that trail on documented ground: SOC 2 Type II and ISO 27001:2022 certified, GDPR compliant, with EU data hosting (Belgium).
Frequently asked questions
What is the difference between thematic analysis and content analysis?
Thematic analysis builds codes from the data to explain meaning and the drivers behind decisions, answering "why." Content analysis applies a predefined codebook to produce comparable counts that sit alongside quantitative data, answering "how many."
Can I use more than one qualitative analysis method on the same data set?
Yes. Sequencing two methods often gives a fuller picture: use thematic analysis to discover themes, then content analysis with a fixed codebook to measure prevalence, as long as you keep the original conversations available for recoding.
What is the biggest mistake teams make when choosing a qualitative analysis method?
Choosing a method out of habit and fitting the research question to it afterward. Write down the question type, the data type, and the claim you need to defend before coding starts, then shortlist the appropriate methods.
How many participants do I need for grounded theory?
Grounded theory determines sample size by saturation, and sampling is iterative: you keep collecting until new data no longer changes the model. Theoretical sampling decides who comes next, so plan a fieldwork window wide enough to add participants, and budget time for manual coding and memos.
How do I report prevalence from qualitative data without overstating it?
Report the denominator, "9/14 participants" rather than "most participants," and count participants rather than excerpts. Pair each count with a verbatim quote and a timestamp, and use quantitative methods on a larger sample for claims about a whole market.

About the author
Florian Hendrickx
Head of Growth
Florian is Conveo’s Chief Growth Officer, leading growth strategy and go-to-market execution as the company scales. He’s held growth leadership roles at companies like Deliverect, Robovision, and Aikido Security, and brings hands-on experience across marketing, sales, and product.
More by Florian →Qualitative insights at the speed of your business.
Conveo runs AI-moderated video interviews and structures everything they say.