In this article
TL;DR
Analysis absorbs every upstream delay. It sits at the back of a linear research process, so findings begin to reflect the schedule rather than the data. Running analysis against conversations as they land removes that compression.
Thematic, content, and narrative analyses answer different questions, and choosing the wrong qualitative data analysis approach can shape what you find before you begin.
Credible analysis rests on traceability: every theme links back to a named participant, a verbatim quote, and the moment on video where it was said.
AI-assisted coding compresses cycle time, and the researcher reviews and overrides every tag.
Consumer Understanding Infrastructure, the standing layer of consumer understanding that decisions run on, keeps the read continuous, so research findings compound rather than reset with each project.
Data analysis in qualitative research gets blamed for late findings, and the blame is misplaced. The problem is rarely that a researcher coded slowly. Analysis sits at the end of a linear research process and absorbs every delay upstream, so understanding arrives in a room where the decision has already been made.
That is decision lag, and it is why good research feels optional to the business. Closing the gap is why insights leaders treat consumer understanding as a standing layer rather than a series of commissions. This guide covers the craft that layer depends on.
What is qualitative data analysis?
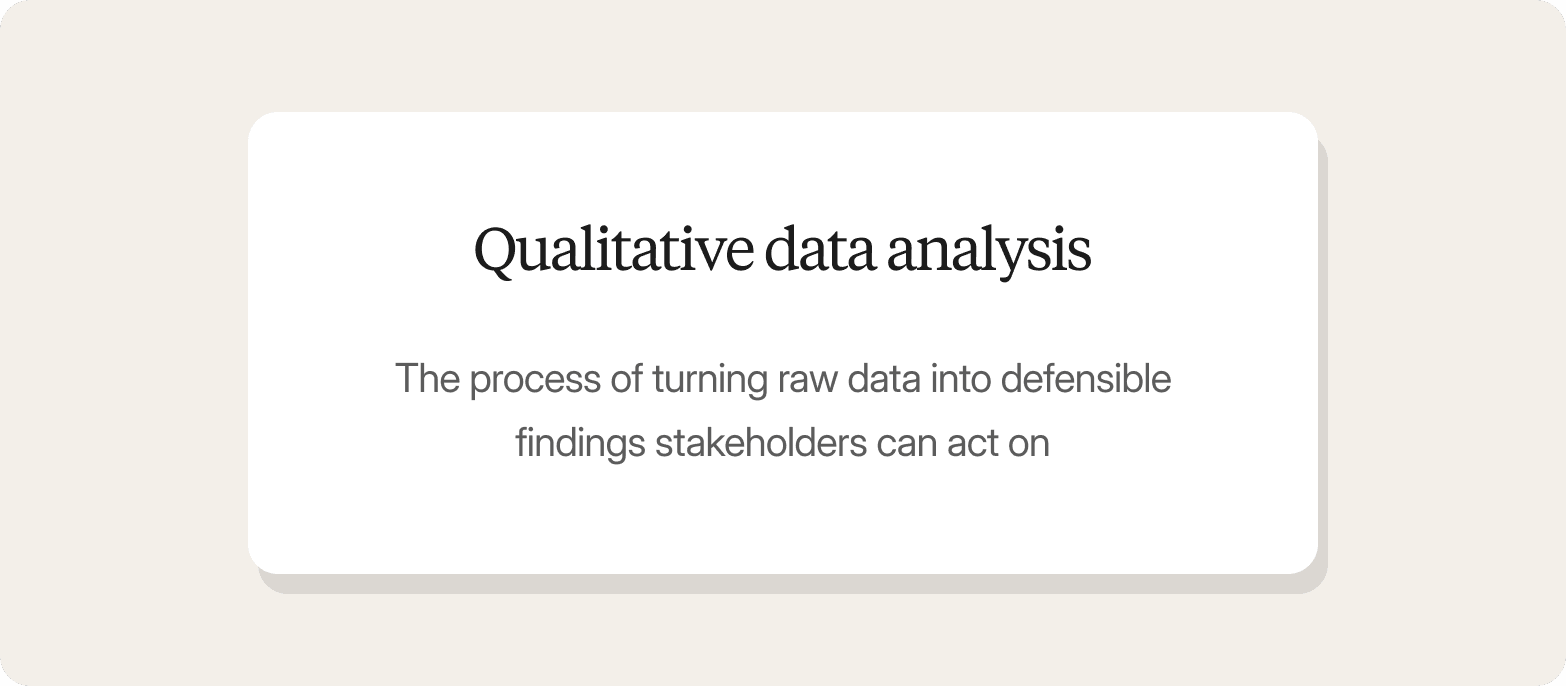
Qualitative data analysis is the process of turning raw data into defensible findings stakeholders can act on. The raw data is interview transcripts, video recordings, and field notes.
Data analysis in qualitative research covers everything that happens after data collection closes: organizing data, coding it, and interpreting what participants meant. The same qualitative study, run twice with the same research participants and the same codebook, should reach the same conclusions.
Qualitative research relies more on textual or visual data than on numerical data: transcripts, videos, images, field notes, and open-ended survey responses. Quantitative data analysis answers the question of how many, and quantitative methods report the distribution. Qualitative methods explain it.
Interpreting non-numerical data is judgment work. How teams analyze qualitative data determines whether a study informs a decision or documents one that has already been taken.
Rigor comes from traceability: every theme on a final slide must connect back to a specific participant quote or video timestamp. Sample size is the currency of quantitative research, while qualitative work is judged on whether a finding can be sourced to a real person who said it.
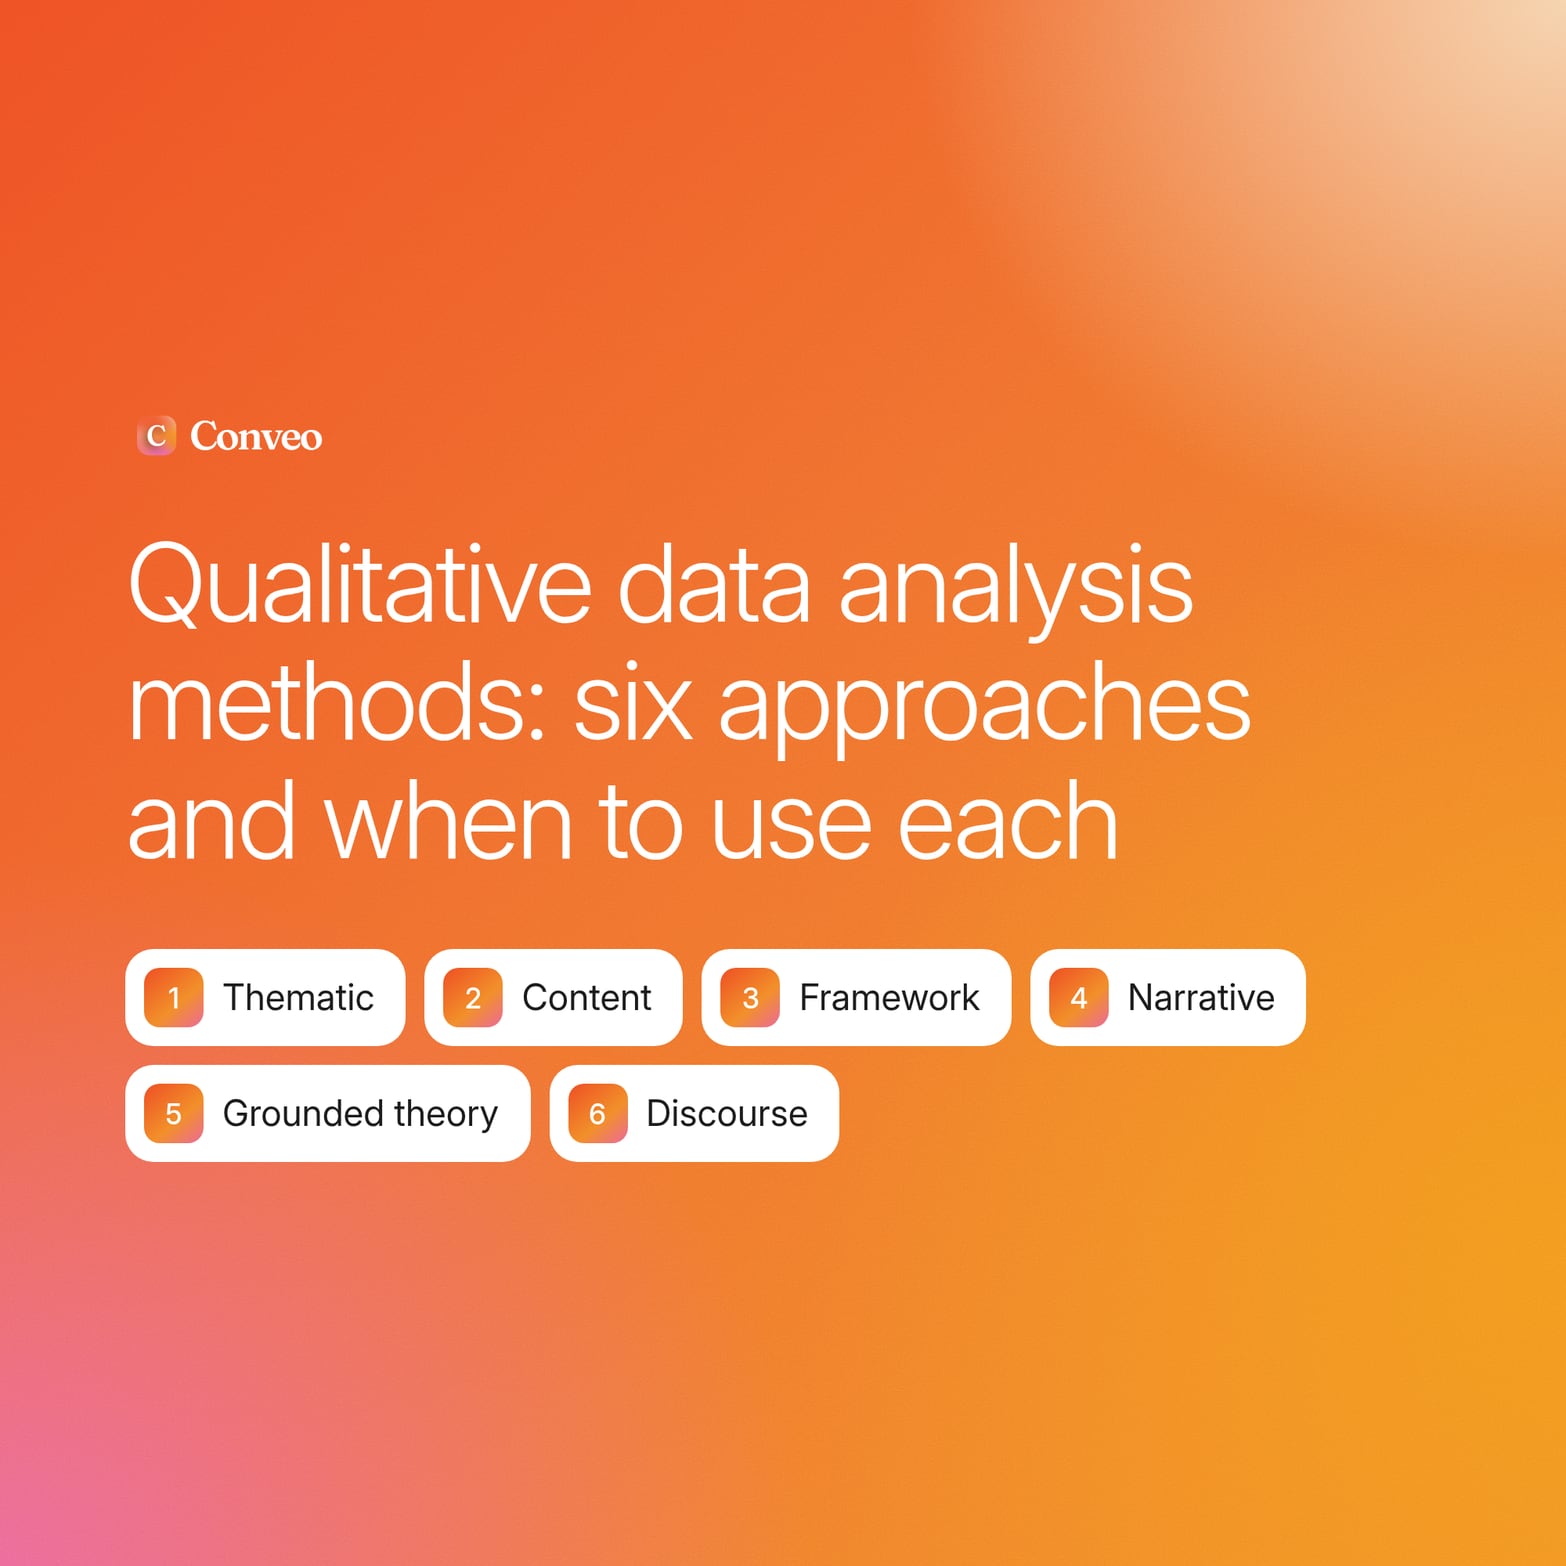
Three qualitative data analysis methods cover most research needs, whether the data comes from depth interviews, focus groups, or open-ended survey responses.
| Method | What it looks for | Codebook | Best dataset size |
|---|---|---|---|
| Thematic analysis | Repeating patterns across a participant set | Emerges and is refined during coding | 20 to 40 interviews |
| Content analysis | Frequency of constructs defined in advance | Fixed before coding starts | 50 or more interviews |
| Narrative analysis | Story structure, sequencing, emotional arc | Minimal; the account is the unit | 20 to 30 interviews |
Other qualitative research methods address narrower questions. Framework analysis maps findings to a predefined matrix, discourse analysis treats language itself as the object of study, and grounded theory builds toward theory development rather than an immediate decision.
Choosing a qualitative research approach before you have settled the question shapes the answer. The choice depends on the research objectives, not the qualitative data analysis software you happen to own. Run as a phase after fieldwork closes, though, any of these methods arrives late by design.
Why data analysis in qualitative research breaks down in practice
The typical agency-led qualitative cycle runs for weeks. Recruitment takes longer than planned, data collection and moderation run over, and analysis absorbs whatever time is left.
That compression is structural. No standardized qualitative coding process reduces cycle time without sacrificing rigor, so when fieldwork slips, analysis pays the price. Manual coding across a set of 30 to 40 interview sessions takes weeks.
When those weeks are not available, qualitative researchers cut corners they would rather not cut. They force themes into the hypotheses the study was designed to test, and smooth over contradictions among participants rather than interrogate them. The analyzed data then reflects the time pressure as much as what participants said.
The credibility problem is specific
A theme that cannot be traced back to a named participant, a verbatim quote, or a video timestamp does not survive stakeholder scrutiny. Workshop-built personas and outputs generated from synthetic summaries fail the same test. When a brand director asks who actually said this, the answer must be a real person with a verifiable source. Without it, people question, hedge, and ignore research findings.
The cost lands outside the insights team
Most insights teams recognize the choice this creates:
Wait for findings that land weeks after the decision window closed.
Proceed on quantitative data and internal assumptions instead.
Substituting quantitative research for a qualitative read addresses a different question, so neither option is good.
The consequence reaches well past a late deck. It is a launch that slips a quarter waiting for a read on positioning, media spend committed against a message participants had already stopped recognizing, and portfolio calls made on understanding that is a year old.
The resolution is analysis that runs against conversations as they land. When each completed interview feeds into synthesis on arrival, a fieldwork slip no longer costs as much analysis time, and each study leaves behind coded data the next one builds on. Our overview of always-on consumer understanding covers how teams sequence that.
"I had a study live by 6:15 p.m., and I had results by first thing in the morning."
Matt Harris, Research & Insights Lead, Canva
The qualitative data analysis process: Step by step
Data analysis in qualitative research follows a structured process regardless of method. Rigor comes from documenting every interpretive decision and maintaining a clear line from each theme to the source quote that supports it. The qualitative analysis process below applies whether a study conducts 20 interviews or 200, and it is iterative: later steps regularly send you back to earlier ones.
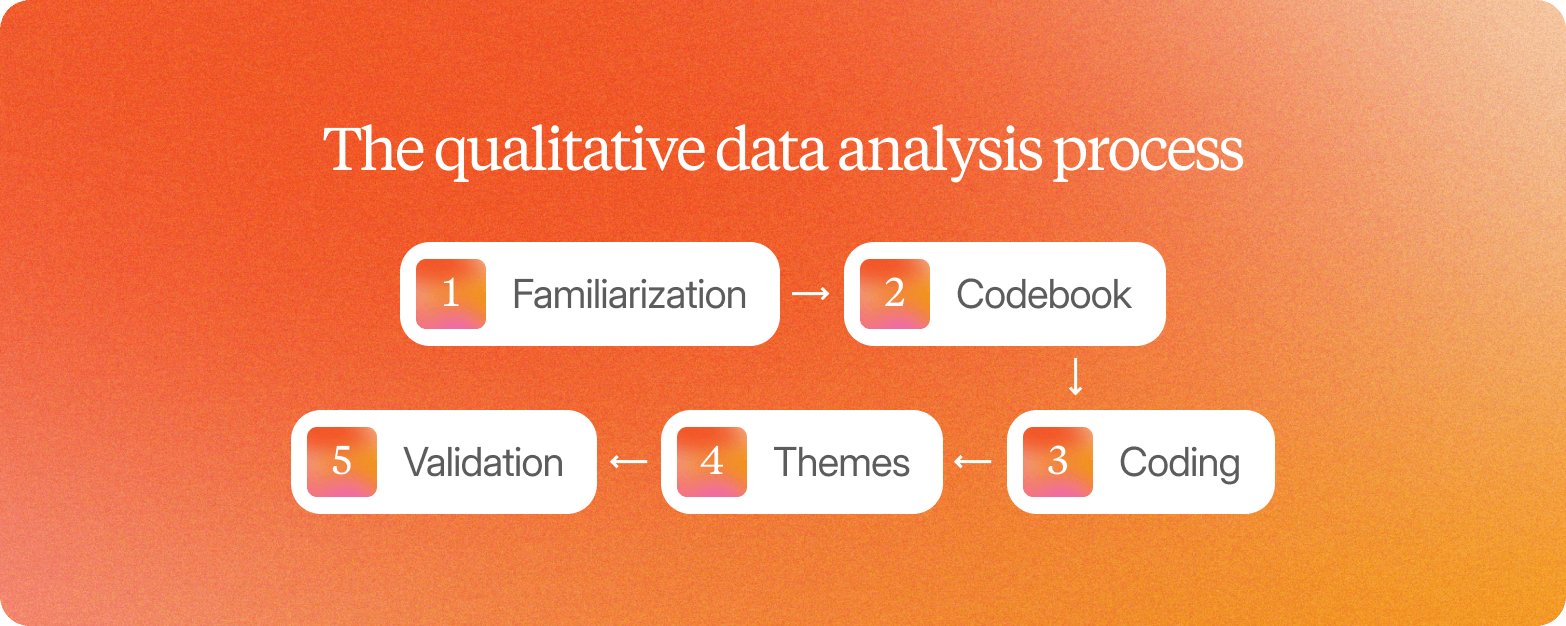
| Step | What you produce | Where it goes wrong |
|---|---|---|
| 1. Familiarization | A working model of the raw data | Coding before reading enough of it |
| 2. Codebook | Defined codes with examples | Definitions two analysts read differently |
| 3. Coding | Tagged transcript segments | Over-coding, which buries the pattern |
| 4. Themes | Explanations tied to specific quotes | A repeated code mistaken for a theme |
| 5. Validation | Findings carrying source evidence | Testing a theme on the first three quotes |
1. Familiarization and immersion
Before writing a single code, read through eight to twelve interviews in full. The goal is orientation: you are building a mental model of the raw data before imposing structure on it. Read transcripts, watch video, and note initial impressions without assigning codes. You are there to identify patterns worth coding, and the notes you take here feed subsequent analysis.
Transcripts alone are incomplete when tone or hesitation carries meaning. A participant who pauses before answering a pricing question, or whose voice flattens when describing a brand experience, is communicating something text cannot capture. Reviewing video keeps that visual data attached to the analysis. Teams that collect data continuously start this pass while fieldwork is still open, which leaves room to sharpen the guide mid-study.
2. Developing the codebook
A codebook is the analytic framework for a study: a shared document listing every code, paired with a definition and an example of what qualifies. Without it, one analyst codes a comment as "price concern" while another codes it as "value perception," and the two never reconcile. That drift is the most common source of inconsistency in multi-analyst projects.
Start with 15 to 25 codes. Codes that prove too thin get folded into broader categories as coding proceeds.
Codes come from two directions, and most studies use both:
Deductive codes are defined in advance from the research question.
Inductive codes emerge as analysts notice language the discussion guide did not anticipate. The approach has roots in grounded theory, where codes are built from the data and refined through constant comparison as each transcript arrives.
Refine the codebook after the first few transcripts so that adjustments apply across all sessions, since codebook development is an iterative process. Our glossary entry on the codebook covers the core structure.
3. Coding transcripts
Coding means tagging segments of textual data or video with a label from your codebook. The coding process runs in two passes:
Surface pass. What was said: a participant mentions price, a participant expresses hesitation.
Interpretive pass. What it stands for: price as a proxy for quality concern, hesitation as a trust signal rather than a product objection.
Keep codes granular enough to support further analysis, but not so specific that each appears once. The most common mistake is over-coding: coding everything produces noise that obscures the patterns you are trying to surface and pushes cleanup into subsequent analysis.
You can analyze qualitative data by hand or inside a tool, and the interpretive calls are the same either way. Traditional qualitative data analysis software speeds up the mechanics of tagging, and deciding what deserves a tag stays with the researcher. Researchers using Conveo review pattern candidates the platform surfaces from moderated sessions, then confirm, correct, or override each one against the video and the verbatim, so the coded data reflects the participant's meaning rather than a model's reading of it.
4. Identifying themes
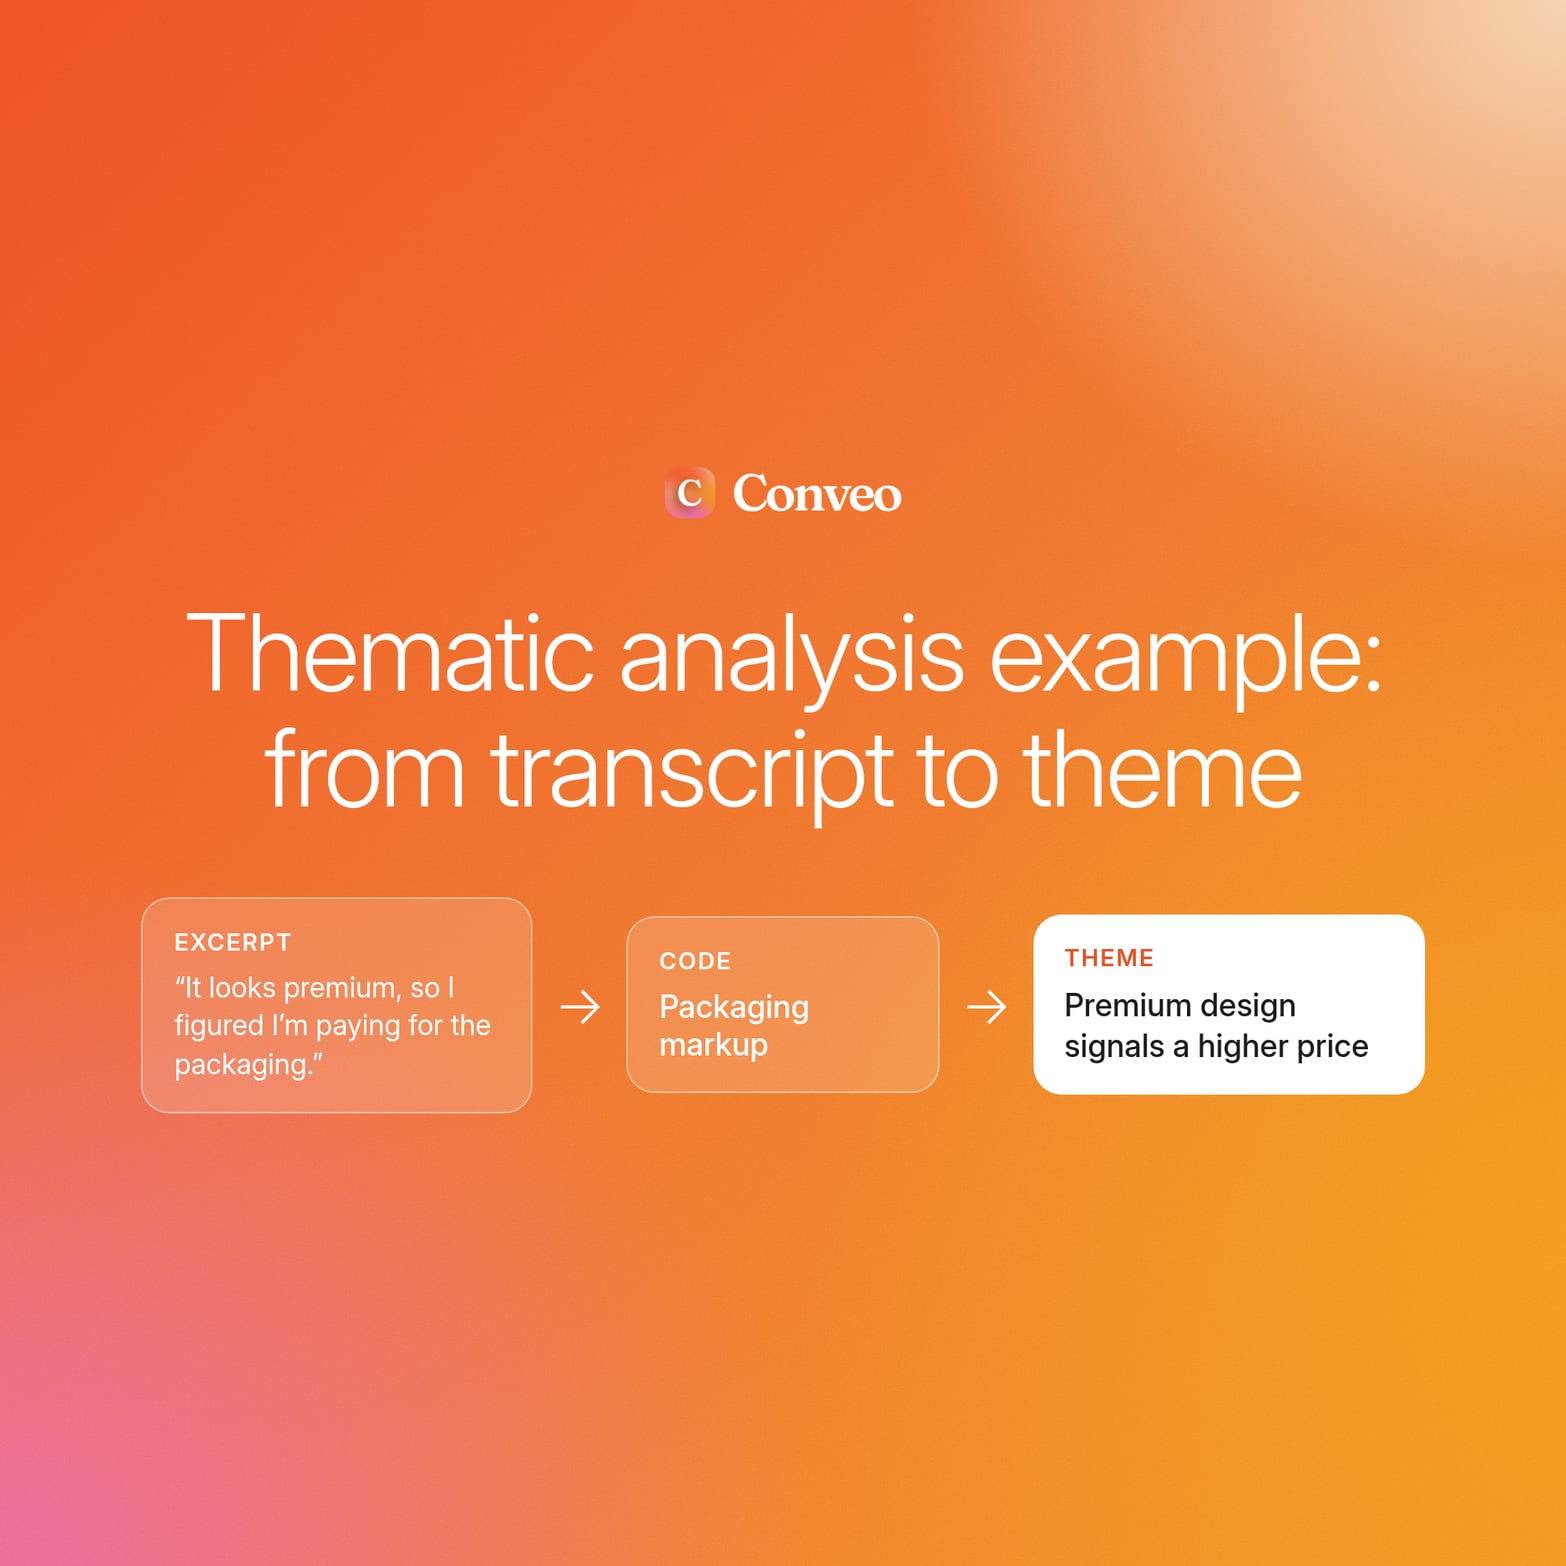
A code marks what was said. A theme explains what it means: why customers hesitate at a price point, why they abandon a product they initially liked. Stakeholders act on explanations, and the theme is where the explanation lives.
Themes emerge when you step back from individual codes, group them into broader categories, and look for patterns running across research participants and code types. A theme earns its place when you can trace it to specific quotes or a precise moment in a recording. Testing a candidate theme against later transcripts is, in practice, constant comparison.
Contradictions deserve the same attention as consensus. If eight participants describe a product as trustworthy and two describe it as opaque, the two mark a segment, an edge case, or an experience that is inconsistent across contexts, and they deserve further analysis instead of deletion. Flattening them into the majority view produces findings that look clean and mislead decisions.
5. Validation and reporting
Validation confirms that every theme holds across the full analyzed data, well beyond the three quotes you read first. Return to the full transcript set, test whether the pattern appears consistently, and note where it breaks down or applies to one segment.
Research findings that reach a decision-maker should include source evidence: a direct participant quote, a video clip with a timestamp, and enough participant context to be interpretable. Segment, behavioral profile, and usage context matter, and demographic labels alone do not.
When findings live only in decks, teams report having to rerun the same questions six months later because nobody can locate what was already learned. That is a data management problem as much as a research one. Conveo's searchable insight library stores and connects every theme, quote, and clip, so the next question starts from existing understanding instead of a blank page.
Thematic analysis: The default method for most studies
Thematic analysis is the most widely used qualitative data analysis approach because it adapts to almost any research question: concept testing, journey mapping, brand perception across segments. It does not require a fixed framework before fieldwork begins, which makes it the qualitative research approach most teams default to when the answer is not predictable in advance.
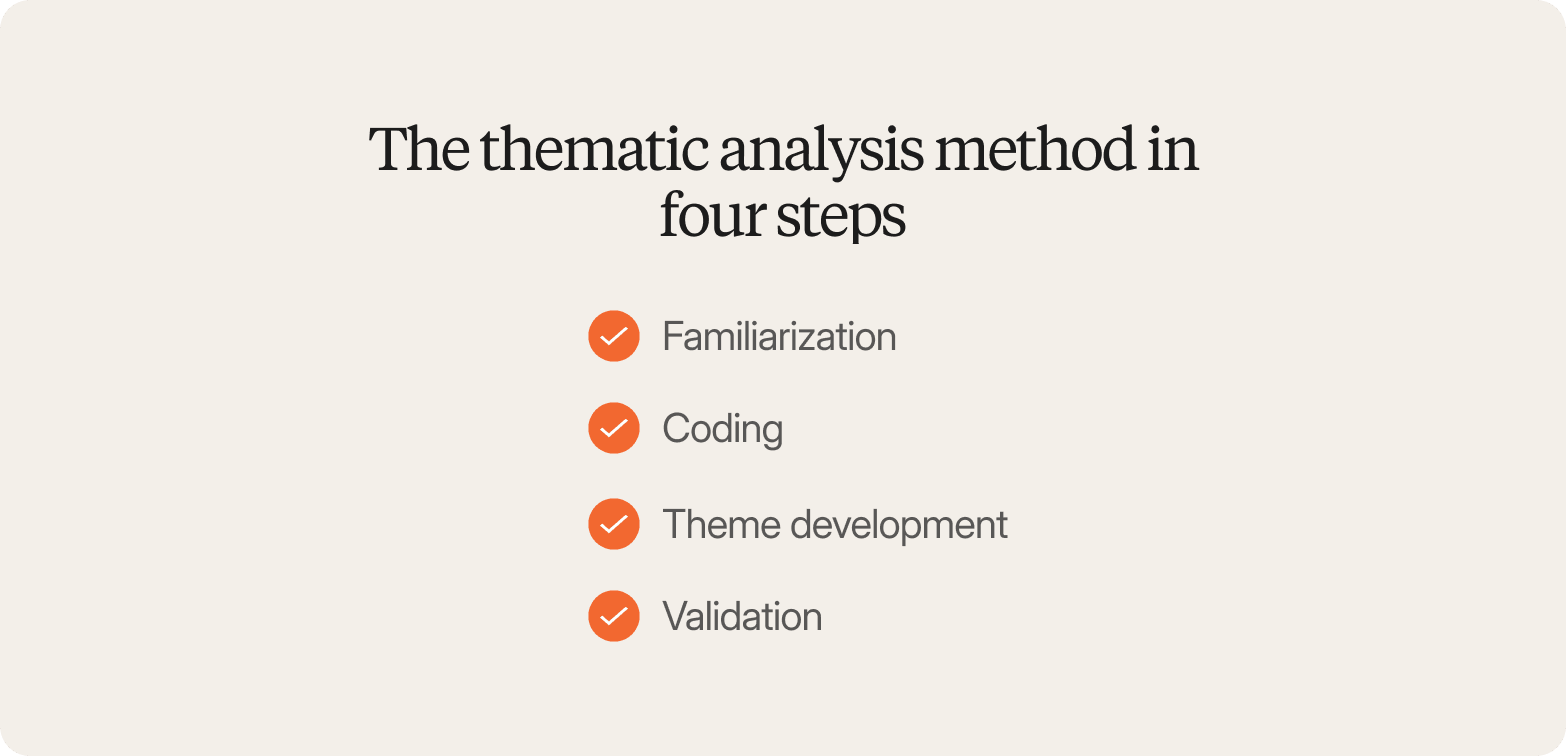
The method runs in four steps:
Familiarization with the transcripts and video before any coding starts.
Coding segments with descriptive labels close to the data.
Theme development that groups those codes into higher-order patterns.
Validation of each theme against source evidence.
A worked thematic example
In a representative scenario, illustrative rather than a real client engagement, a SaaS company runs a research project of 30 depth interviews to understand why trial users do not convert. Initial codes include "onboarding confusion," "pricing concern," and "feature gap." After grouping, three themes emerge.
Perceived complexity: users expected a straightforward product, but instead received an enterprise-grade configuration.
Value uncertainty: users could not articulate ROI to their manager during the trial window, so the internal case for purchase was never made.
Switching cost: users already had a workflow embedded elsewhere and did not see enough upside to migrate.
Each theme is supported by 8 to 12 participant quotes, video clips showing hesitation points, and behavioral evidence: the users who churned had spent fewer than 10 minutes in the product during the trial. That combination is what makes qualitative research data analysis credible to stakeholders who were not in the room.
Inductive, deductive, and knowing which question you have
Inductive analysis lets themes emerge without a prior framework. Deductive analysis tests themes defined in advance against the evidence. Inductive analysis takes longer, and it protects against confirming what the team already assumed. Most studies use both, beginning with a loose framework tied to the research objectives, then refining it based on what participants say.
Like most qualitative methods, thematic analysis works best on exploratory questions. "Why are customers churning?" is a strong thematic question. "Do customers prefer feature A or feature B?" is better answered through preference ranking. Our thematic analysis guide works through both cases.
Content analysis: When you need consistent coding
Content analysis is the most structured of the qualitative data analysis methods. Teams reach for it to code specific constructs consistently across large volumes of textual or visual data: feature mentions in feedback, complaint categories in support transcripts, brand perception signals in open-ended survey responses. It is one way to bring order to unstructured data at scale, and it measures what you already have a framework to find, rather than surfacing what you do not know.
The codebook is built before a transcript is opened, and coder reliability is checked throughout, ensuring that two analysts coding the same passage reach the same conclusion.
A worked content analysis example
In a representative scenario, again illustrative rather than a real client engagement, a CPG brand runs 150 in-home interviews to understand how families use their product across a typical week. The codebook defines four categories before data collection ends: usage occasion, storage location, household role, and purchase driver.
Two analysts code each interview independently and resolve disagreements before moving on. The output is a frequency table that stays comparable to any future wave run against the same codebook. The same approach works on focus group discussions, where the unit of analysis is the exchange rather than the individual account.
When content analysis is the right call
Three conditions make content analysis the right call:
The constructs are known, so inductive discovery is unnecessary.
The dataset is large, typically 50 or more interviews, and consistency matters more than interpretive depth.
Findings will be compared across waves, where standardized coding is the only credible basis for comparison.
That comparability is what makes content analysis the bridge between qualitative and quantitative methods.
The main risk is rigidity: a codebook built around what the team expected will miss what it did not anticipate. Leaving room for an "other" category, reviewed separately at the end, keeps emergent findings from being closed off. Qualitative software helps with volume, and only where the researcher keeps the final call on every tag.
Narrative analysis: When the story matters
Narrative analysis occupies a specific corner of qualitative data analysis. Reach for it when a purchase decision or a behavior change is best explained through story structure, sequencing, and emotion rather than isolated themes.
Where thematic analysis asks what patterns appear across participants, narrative analysis asks how this person constructs their account of what happened. Where discourse analysis focuses on the language itself, narrative analysis focuses on the shape of the account. The goal is the experience from the inside, on the participant's own terms, rather than generalizable patterns or theory development.
A worked narrative example
In a representative scenario, illustrative rather than a real client engagement, a healthcare company runs 20 depth interviews with patients who switched from a competing treatment. A thematic pass might surface "side effects" and "cost" as recurring codes.
Narrative analysis goes further. Participants describe small frustrations accumulating over months: a missed appointment, an unexplained billing charge, a side effect that felt manageable until it did not. The moment the switch becomes urgent is often minor in isolation, and the story around it gives it weight. That changes how the marketing team frames retention, moving from "we have fewer side effects" to "we make the small things feel handled."
Scope and pairing
Narrative analysis fits three conditions:
The question involves change over time.
Emotion and context carry as much weight as rational criteria.
Depth matters more than generalizing across a population.
Beyond 20 to 30 interviews, careful reconstruction becomes prohibitive. Few qualitative research methods scale so poorly and repay the effort so well within their range. In practice, it pairs with thematic analysis: narrative work surfaces the why behind a theme, and thematic analysis tests whether the pattern holds across the broader dataset.
What makes qualitative analysis defensible?
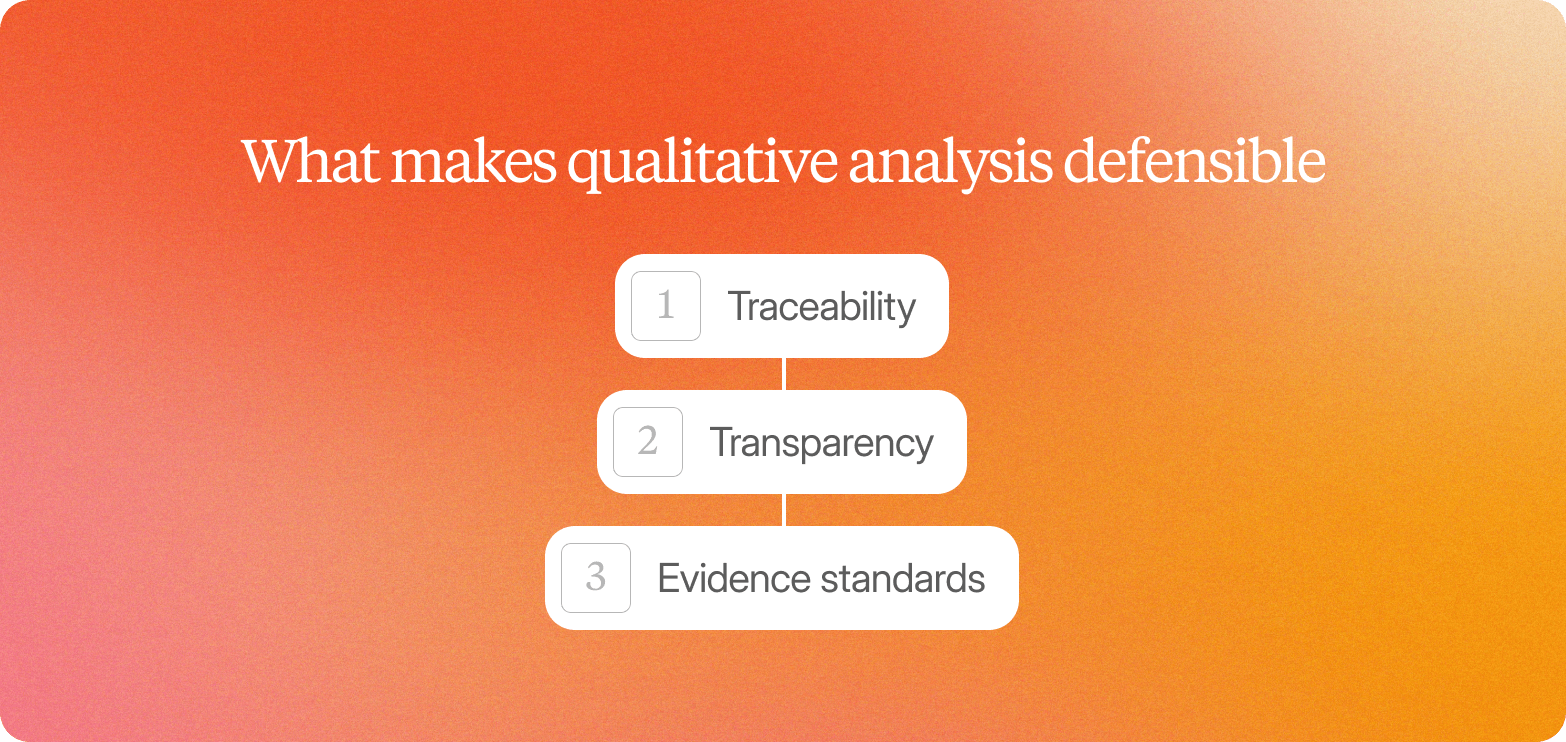
Qualitative analysis loses credibility the moment a stakeholder asks where a finding comes from and nobody can point to a participant or a timestamp. Traceability is what separates rigorous analysis from summarization, and three standards carry most of the weight in qualitative research data analysis. Those standards are borrowed rather than invented: qualitative methods draw on conventions from health services research and program evaluation, where traceability requirements were established long before commercial insights teams adopted the same methods.
1. Traceability
Every theme needs a line back to a specific person who said it, in their own words, on video. When a stakeholder pushes back, "who said this?" is never rhetorical: the answer must include a participant, a segment, and a timestamp.
Workshop-synthesized themes and generated personas break down here, because they produce plausible-sounding patterns without source evidence. A theme labeled "participants expressed concern about pricing" is a summary with no evidence floor. Our note on using video in qualitative research covers how to present that evidence to stakeholders.
2. Transparency
Defensible analysis requires a record of every methodological decision: how the codebook was developed, how the coding process ran across sessions, how themes were validated, and how contradictions were handled. Rigorous analysis leaves a record of how it was done, and the practical test is replicability. If a second researcher working with the same transcripts reached materially different conclusions, the analysis cannot be defended.
Teams running longitudinal or continuous programs feel this most. Documenting the qualitative analysis process is what makes wave-over-wave comparison meaningful rather than approximate: an analytic framework recorded once, applied consistently, and updated deliberately. Qualitative research relies on judgment at every step, which is exactly why the judgment needs a paper trail.
3. Evidence standards
Stakeholders who were not in the room need evidence to support a conclusion: direct quotes, video clips, and sufficient participant context to judge whether the finding applies to their decision. Attributing a quote to "female, 35 to 44" tells a stakeholder almost nothing. Attributing it to "a heavy category user who switched brands in the last six months" tells them whether the perspective bears on their decision.
Contradictory data belongs in that record too. When three participants say one thing, and one says something sharply different, the instinct is to treat the outlier as a sampling error. In the average qualitative study, that outlier often marks a segment difference or an assumption the discussion guide did not anticipate, and collapsing it into the majority view produces a cleaner deck and worse decisions.
How Conveo changes the analysis timeline
Analysis has always been the phase where qualitative timelines collapse. The sequencing changes first; the speed is a consequence.
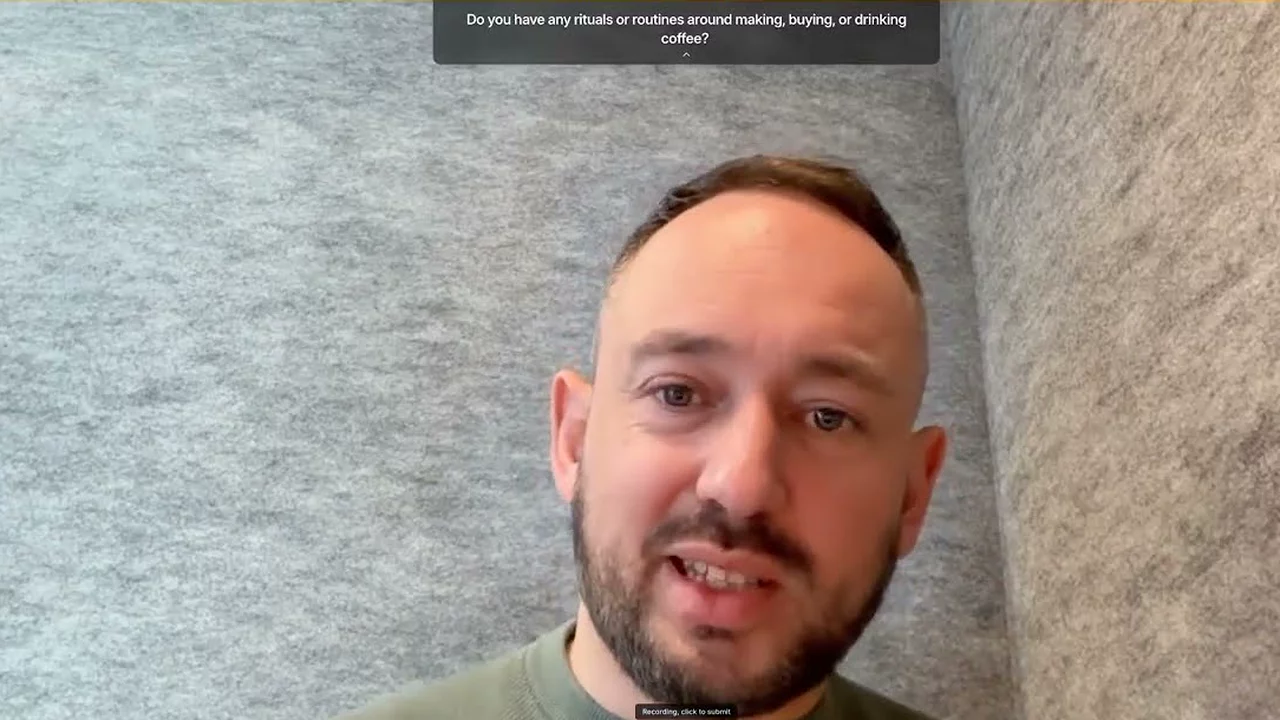
Conveo's AI research assistant runs the interview itself, probing on what a participant says rather than reading a fixed script, across 50+ languages. Because each session is transcribed and structured as it closes, the researcher opens a study that is ready for review rather than a folder of raw data. Conveo StoryLines applies the same logic to an ongoing program: wave-based, AI-moderated research for teams that need a standing read of their market, under the banner of Continuous Consumer Understanding.
The walkthrough below shows how an AI-moderated video interview runs, start to finish.
What the platform handles, and what the researcher decides
| The platform handles | The researcher decides |
|---|---|
| Transcribing audio and video | What a statement actually means |
| Applying a defined codebook to textual data | How to resolve an ambiguity |
| Running sentiment analysis across sessions | Which themes are decision-relevant |
| Surfacing frequently mentioned topics | Which patterns are noise |
| Surfacing where participants disagree | Whether a finding is ready to report |
Tools like these identify patterns at volume, and that holds up as the dataset grows. The right-hand column needs someone who knows the category. A participant who says "it's fine" in a flat tone may be signaling resignation, and a cluster of mentions around price may reflect confusion rather than sensitivity.
The workflow, in sequence
Automated transcription turns a folder of unstructured data into a reviewable record, so researchers move to coding the day fieldwork closes.
Pattern candidates get reviewed before they get accepted. The codebook is applied across sessions, and the researcher checks every tag against the source, overriding it where tone is missed or a code is applied too broadly.
Theme decisions stay human-led. Patterns get surfaced by frequency and co-occurrence, and the researcher decides which ones constitute themes worth reporting.
Validation depends on traceability. Every theme links back to specific participant quotes and video moments, and the record shows which sessions contributed to each finding.
Step two is where many analysis software tools fall short. Systems optimize for coherence and frequency, so they miss the hesitation in a voice or the theme that appeared twice and signals a real segment need. Human review is where research experience enters the analysis, and it is what frees qualitative researchers from formatting transcripts so they can focus on interpreting findings.
Participants tend to be more candid with an AI research assistant than in front of a person, which matters because candor is what the analysis rests on.
"The analysis is instantaneous. I can synthesize all the data, and also go back and watch every interview. You can ask it to challenge your own thinking. It's so easy to talk to your data."
Dafydd Jones, Associate Director, Ninth Seat
Enterprise insights teams at Google, Unilever, AB InBev, Kellanova, General Mills, and JDE Peet's rely on Conveo to understand their consumers.
Conveo's searchable insight library holds every theme, quote, and clip and connects them. Organizing data as it arrives rather than at the end is what makes that work, and managing data across studies turns a series of research projects into a body of understanding.
For procurement, the platform is SOC 2 Type II certified and GDPR compliant, with European hosting and primary infrastructure in Belgium.
Decision lag closes when analysis is no longer the last phase in a linear research process.
Frequently Asked Questions
What is qualitative data analysis?
Data analysis in qualitative research is the process of turning transcripts, video recordings, and field notes into findings that stakeholders can act on and defend. It works with non-numerical data, meaning language, context, and meaning instead of numerical distributions, and its rigor comes from traceability: every finding links back to a real participant who said it.
What are the main qualitative data analysis methods?
Thematic analysis identifies patterns across a set of participants. Content analysis applies a predefined codebook consistently across a large dataset. Narrative analysis reads the sequence and emotional arc of an individual account. Framework analysis, discourse analysis, and grounded theory cover narrower questions, and most commercial studies use one of the first three. Choose thematic analysis when the question is exploratory, content analysis when the constructs are already defined and consistency matters most, and narrative analysis when sequence and emotion carry the explanation.
How long does qualitative data analysis take?
Coding a full interview set by hand typically runs into weeks, and that assumes a clean codebook, experienced analysts, and no fieldwork delays. Teams that collect and analyze data in parallel, so that the qualitative research process no longer runs end-to-end, report bringing coding time down to days.
What is the difference between a code and a theme?
A code marks what was said, for example, a mention of price. A theme explains what it means, for example, price standing in as a proxy for a quality concern. Stakeholders act on explanations, so the analytical work is moving from one to the other with the evidence intact.
How many interviews are enough for qualitative data analysis?
It depends on the method and the decision. Thematic studies commonly run 20 to 40 in-depth interviews or six to eight focus groups, and content analysis benefits from 50 or more. Narrative analysis becomes impractical much beyond 20 to 30, given the reconstruction each account requires.
Can AI do qualitative data analysis?
AI handles transcription, applies a defined codebook at volume, runs sentiment analysis, surfaces frequently mentioned topics, and surfaces where participants disagree. Qualitative software of any kind reports patterns, and resolving ambiguity or deciding which themes are decision-relevant stays with a researcher who reviews, overrides, and owns every coded tag.

About the author
Meg Gerli
Research Impact Lead
Meg is a Research Impact Lead at Conveo, working with insights and research teams on the studies they run with Conveo.
Meet Meg on film →Qualitative insights at the speed of your business.
Conveo runs AI-moderated video interviews and structures everything they say.