In this article
TL;DR
A voice of the customer (VoC) survey measures prevalence: how many customers feel, rate, or report something a certain way. Explaining why takes a different instrument.
Surveys do three things well: measure prevalence, track trends, and segment customer sentiment and preferences. They struggle at the edges of correlation, and typically suffer from low survey response rates too.
The gap between "the score moved" and "why it moved" is where misdirected remediation and organizational trust in research both break down.
Decision-focused question design, a three-layer probe structure, and a consistent coding taxonomy turn unstructured feedback into structured feedback a team can act on, whether it arrives as customer satisfaction questions, VoC survey questions, or customer input.
Pairing customer satisfaction score data with AI-moderated, traceable conversations closes the gap and produces qualitative insight that drives real business outcomes, in a single connected program.
What is a voice of the customer survey?
By the time a follow-up study explains why a satisfaction score dropped, the product team has usually shipped a fix based on inference, and the decision the research was meant to inform has already been made. That lag is the real cost of running voice of the customer surveys in isolation: they tell you a metric moved and leave the team guessing at what to do about it until the window to act has closed.
A voice of the customer survey is a structured instrument measuring how widespread a sentiment, behavior, or experience is across a customer population: the prevalence question, how many customers feel this way, rate this positively, or report encountering this problem. No serious market research program runs without it. When a satisfaction score drops, when purchase intent shifts, when a product attribute gets rated poorly across a segment, the survey captures the signal, telling you the metric moved and how many people moved it. That statistical picture, built from customer data collected at scale, is what makes findings defensible to stakeholders, though it rarely produces customer insights on its own.
Most VoC programs exist because a business decision needs customer input: a pricing change, a feature bet, a churn-prevention initiative. Getting that input right matters for business success and business growth, since teams that understand customer sentiment early avoid the expensive, reactive fixes that come from guessing. At its core, a VoC program is about understanding customer needs well enough to act on them, which is what builds customer engagement and durable customer relationships over time.
The limitation is equally specific: surveys show prevalence. Causation takes a different instrument. A score is an outcome. It doesn't tell you what the customer was trying to do when the experience broke, or which interaction in a longer customer journey produced the feeling the number reflects. Surveys aggregate responses across large populations, compressing individual experience into a scale, and that is where the gap opens. Enterprise insights teams at Google, Unilever, AB InBev, Kellanova, General Mills, and JDE Peet's use Conveo to pair prevalence data with AI-moderated conversational depth.
What can a voice of the customer survey tell you?
Surveys do three things well, and every VoC program should build on all three before adding any other method.
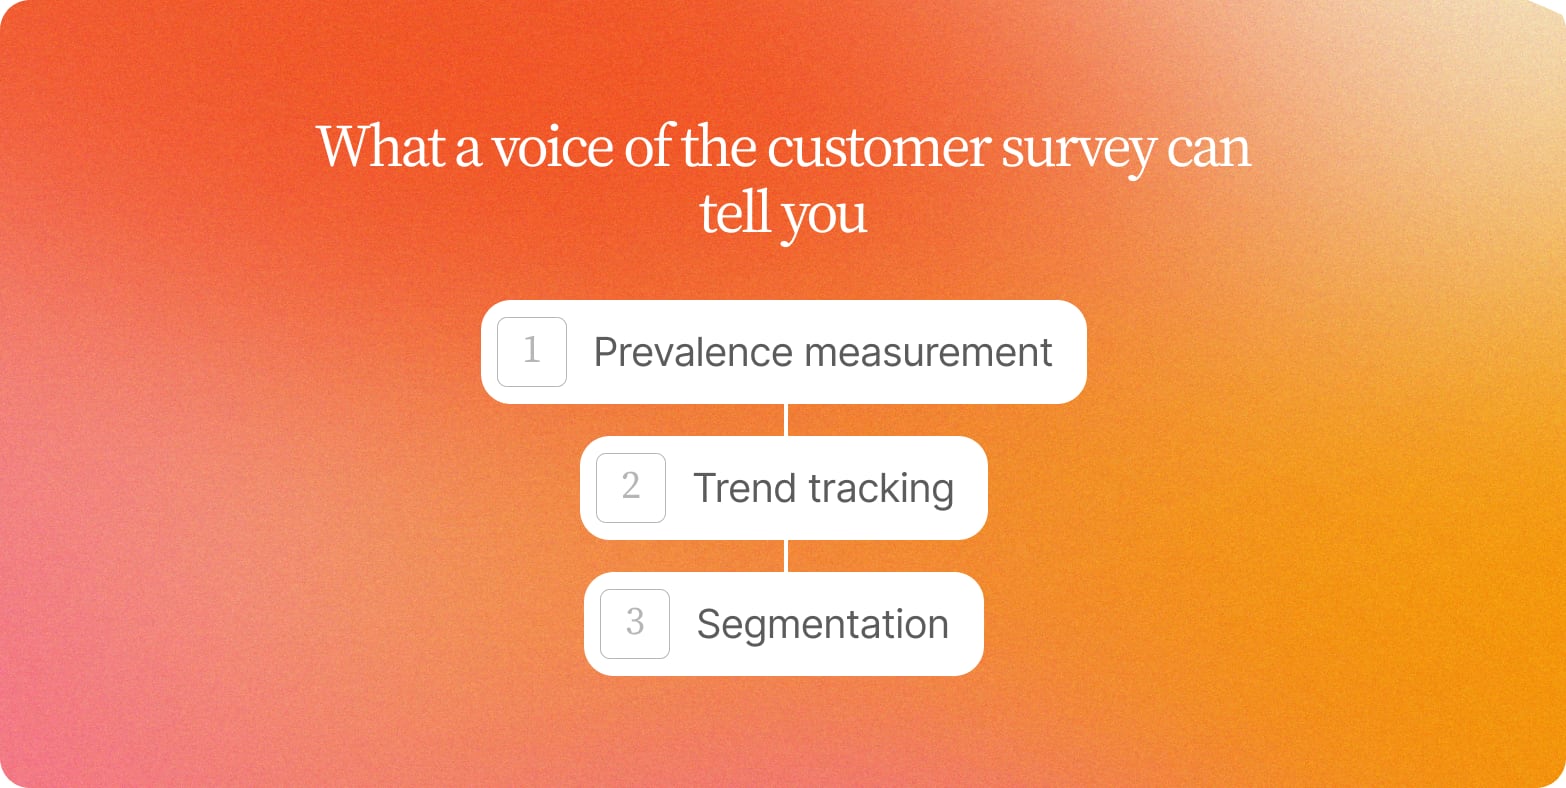
1. Prevalence measurement. A well-designed survey tells you how many customers report a problem, prefer a feature, or rate an experience a particular way. That number underpins prioritization. Knowing a friction point affects 60% of your customer base rather than 6% changes every conversation about where engineering time goes next, and turns vague customer sentiment into something a roadmap review can act on.
2. Trend tracking. When question wording stays consistent across waves, surveys become a reliable signal of direction: whether customer satisfaction is improving, declining, or holding steady. Without consistent wording, you cannot separate genuine movement from measurement noise.
3. Segmentation. Surveys reveal whether sentiment differs by customer tenure, product tier, geography, or usage pattern, and surface how customer preferences diverge across those groups. A single aggregate satisfaction score tells you something is wrong. Segmentation tells you for whom.
The metrics behind the prevalence number
Most VoC programs lean on a small set of standardized metrics to make prevalence comparable across waves and segments:
| Metric | What it asks | Survey type | What it's best at |
|---|---|---|---|
| Net promoter score | How likely a customer is to recommend the product | Relationship survey | Captures the overall state of the customer relationship over time |
| Customer satisfaction score (CSAT) | How satisfied a customer was with a specific interaction or purchase | Transactional survey | Fielded immediately after a support interaction, a purchase, or a first use of the product |
| Customer effort score (CES) | How much effort it took to get something done | Transactional survey | A widely used early-warning signal for customer churn, since friction pushes satisfied customers toward a competitor before dissatisfaction does |
Tracked across enough customer interactions, the effort score often moves before satisfaction does, making it an early warning signal for teams trying to keep pace with what customers expect.
None of these three metrics explain themselves. A dropping net promoter score, a weak customer satisfaction score, or a rising customer effort score points to the same structural gap: something changed in customer sentiment, and the customer journey holds the reason why.
In a representative scenario, a VoC survey might show that 42% of shoppers trying a reformulated snack bar for the first time rate the taste as worse than the original, compared to 18% among long-term buyers who already expect the brand's flavor profile. That difference in prevalence justifies fixing the first-trial experience for new buyers rather than reformulating again in a way that would frustrate loyal repeat buyers.
Surveys start to strain at the edges of correlation. Shoppers who rate a new formula poorly on taste also tend to rate the pack instructions poorly, and both correlate with lower repeat-purchase intent and, eventually, brand switching. But correlation is not causation. Is confusing pack instructions causing low repeat-purchase intent, or is a deeper formula problem causing both? That VoC data tells you where to look. What you find there still needs a different method to explain.
What a voice of the customer survey cannot tell you
Surveys are precision instruments for measurement. Explaining the experience behind a number is a separate task entirely. A well-designed voice of the customer survey tells you how many customers feel a certain way and how intensely. It cannot tell you what experience produced that feeling, what the customer was trying to do when things went wrong, or which correlated variable is the cause and which is the symptom.
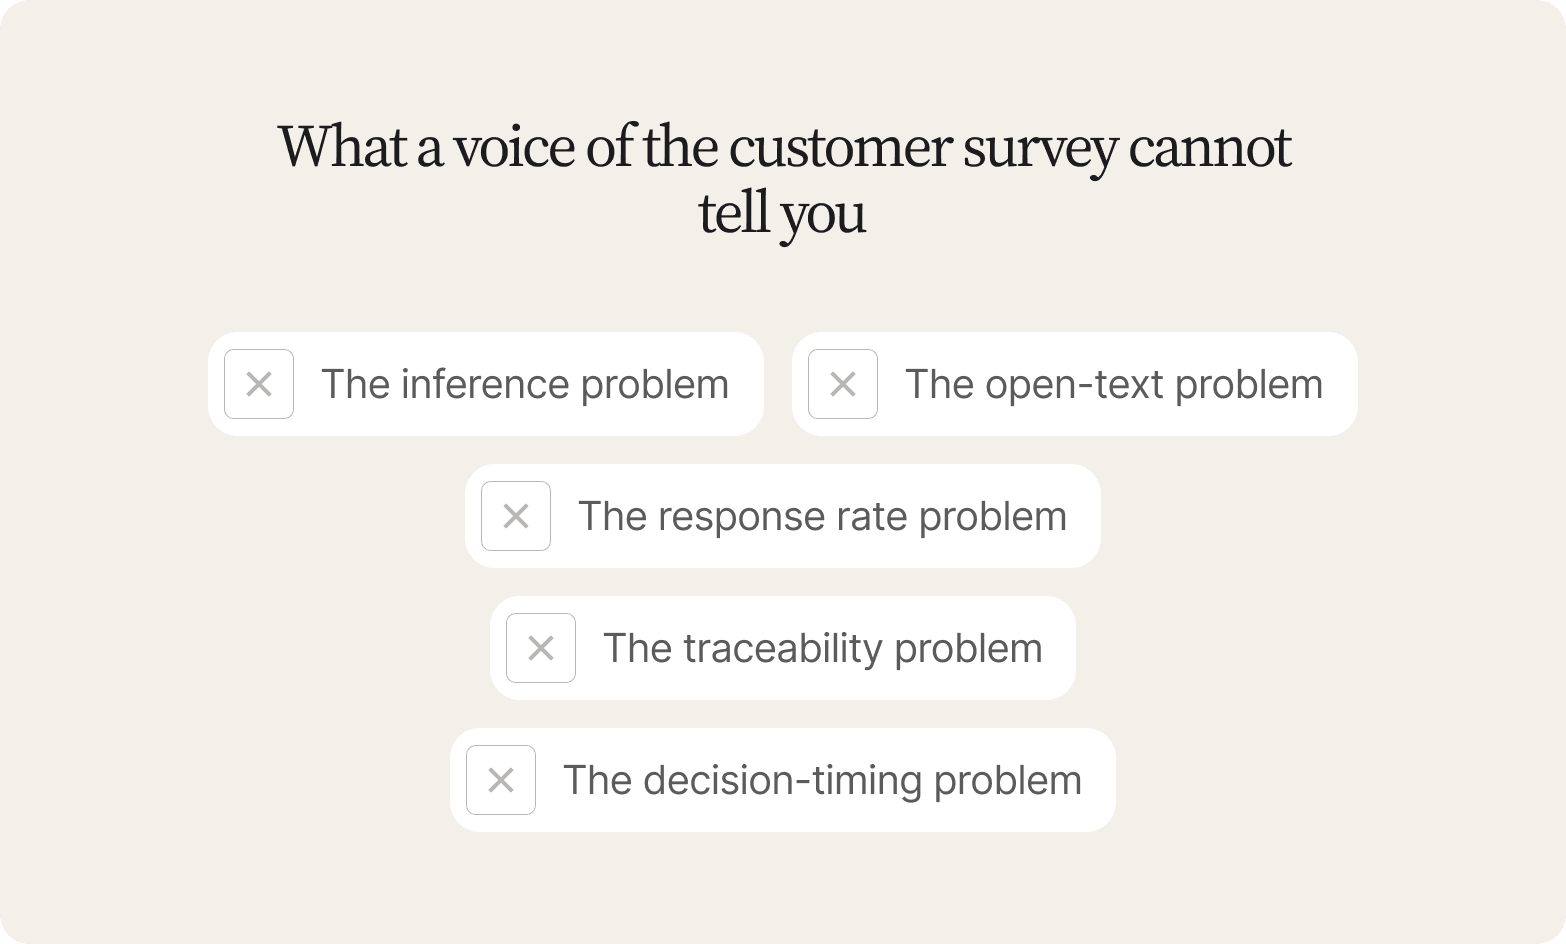
The inference problem
When survey items correlate, teams infer causation. Low taste-satisfaction scores and high in-store return rates appear together in the data, so the team assumes the new formula is the problem and reformulates again. Repeat-purchase intent doesn't move, because the real issue was confusing prep instructions on the pack that led shoppers to prepare it wrong, a question the survey never asked.
The remediation targeted the experience that scored worst. The one that actually caused the score stayed invisible in the survey data, a gap that costs teams months of misdirected reformulation effort, a cost that shows up on a roadmap review long before it shows up as improved customer satisfaction.
The open-text problem
Adding an open-ended question to a survey does not solve this. Without probing, open-text responses stay as unstructured feedback rather than structured feedback, producing weak response quality: they sit at the level of sentiment and never reach the experience behind it. Conveo's AI research assistant follows up in the same session: what were you trying to do, what did you expect, what happened next? Without that follow-up, teams infer cause from a phrase that could mean a dozen things, and never get the qualitative feedback that would tell them which one.
"Even if you're doing dozens of in-depth interviews, multiple focus groups, you get those interesting nuggets and insights. But then you take them to the client and there's always a sense of: is this really a trend? It's very hard to validate, and very hard to demonstrate the difference between an important trend and a one-off anomaly."
Fergus Navaratnam-Blair, VP Trends and Futures, NRG
The response rate problem
Surveys also run into a more mundane limitation: low survey response rates. A relationship survey sent quarterly to a full customer base, or a transactional survey fired after every support interaction, compete for the same shrinking pool of attention. When response rates fall, the customer voice that comes through skews toward the most frustrated and most delighted customers, and the middle, where most customer relationships actually sit, goes quiet. That skew changes how customers interact with the survey and means the VoC data was never a neutral sample.
The traceability problem
Survey analysis typically arrives as a static summary: themes, percentages, and a few cherry-picked verbatim responses. When those findings reach an executive review, a stakeholder questions whether a theme is real and asks to see the underlying evidence, and the research team can't link the claim back to a specific participant, timestamp, or source recording. Themes that can't be traced to verbatim quotes, participant IDs, and source recordings get dismissed or deprioritized. That gap between insight and evidence erodes organizational trust in research, and traceable video closes it: every theme in Conveo links back to the participant, the moment, and the recording that produced it.
The decision-timing problem
Traditional agency research cycles can run for weeks from brief to findings. A voice of the customer survey may flag a score drop in the first two weeks of a quarter. By the time follow-up qualitative research explains why, several things have usually already happened:
The product team has shipped a fix based on inference
The campaign team has adjusted messaging
The decision the research was meant to inform has already been made
Research that arrives after the decision window closes only confirms or contradicts a choice no one can reverse.
Surveys show that a metric moved. Conversational depth reveals what the customer was trying to do when the experience broke. Most teams run these as two disconnected efforts, on two different timelines, with two different vendors. The best teams run them as one integrated program, treating that integration as continuous improvement built into every wave.
How to design voice of the customer survey questions that produce actionable insights
VoC work goes off track at the question design stage when questions are organized around generic topics. Anchor them instead to the specific business decision the research must inform. A study built around "formula satisfaction" generates scores; one built around "Should we revert the reformulation or fix how we explain the change on pack?" generates evidence. The same logic applies to competitive positioning: asking where shoppers switch to a competitor's product and why produces competitive insights a brand team can use, whereas "how do we compare to competitors" produces only an opinion.
Decision-focused question design starts with naming the decision explicitly, then working backward: what experiences, behaviors, and outcomes would a team need to observe to answer it? The guide then evaluates every customer satisfaction question against that single standard. If it doesn't help the team decide, it doesn't belong.
The three-layer probe structure
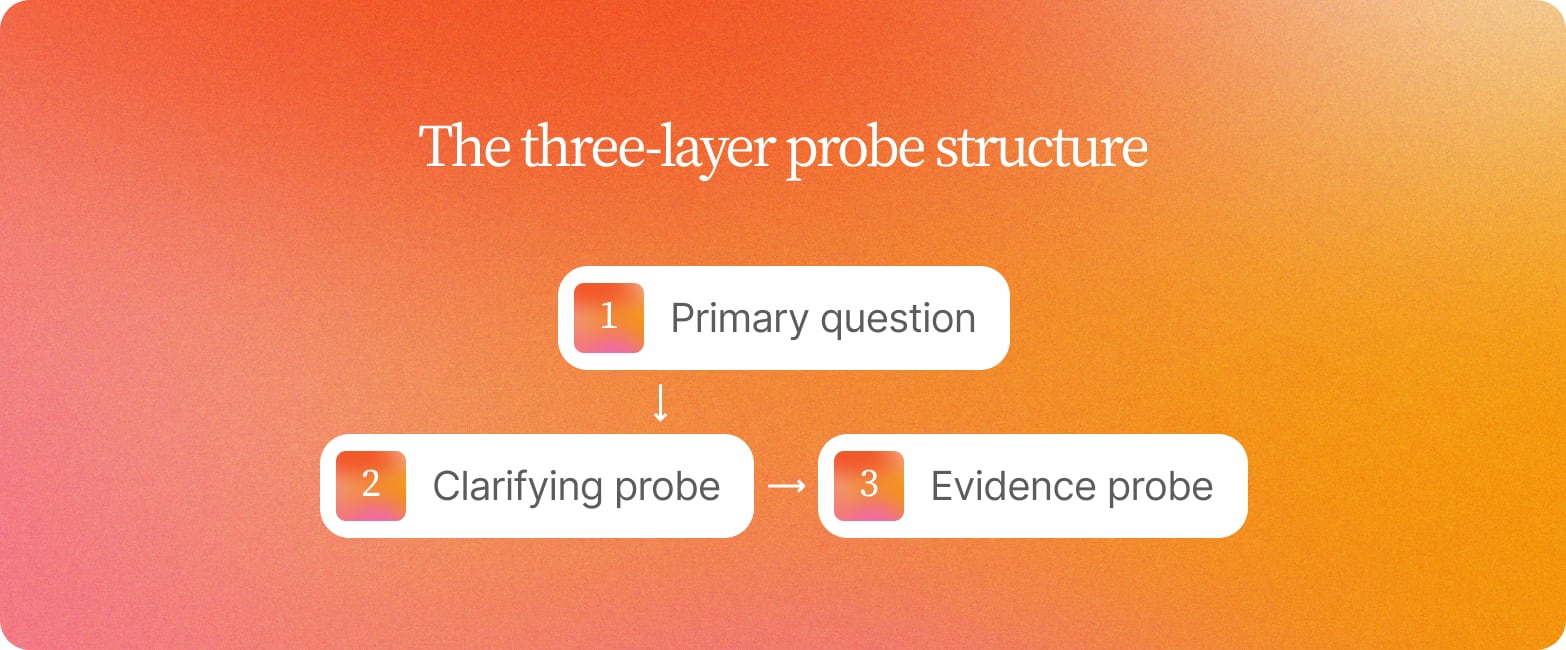
Generic satisfaction items produce unsupported opinions. "How satisfied are you with the new formula?" produces a score with no mechanism behind it. "Walk me through the first time you tried it. What happened next?" produces a reconstructed experience a team can act on. A reliable probe runs three layers deep:
| Layer | Example question | What it does |
|---|---|---|
| Primary question | "What were you trying to do?" | Establishes intent and context before anything else |
| Clarifying probe | "What happened instead?" | Surfaces the gap between customer expectations and reality without leading the participant toward an evaluation |
| Evidence probe | "Can you show me the pack, or the moment where that happened?" | Grounds the account in a specific, traceable moment |
That structure applies to any topic. Instead of asking "How would you rate our support team?", ask: "The last time you contacted support, what were you trying to solve? What happened during that support interaction? What would have made it faster?" The first question produces a number. The second produces a sequence of events, a friction point, and a design implication: the number and the reason, from the same participant in the same session.
The order matters as much as the questions: context, then reconstruction, then evaluation, then implications. Asking for evaluation before reconstruction produces unsupported opinions, since participants haven't yet been given the scaffolding to retrieve a specific experience and instead default to a general impression.
Why chronological reconstruction produces the most actionable findings
The most reliable question pattern in VoC research is chronological reconstruction: "Walk me through the first time you tried it. What happened next?" It surfaces the sequence of events that led to an outcome, mapping a slice of the customer journey in the participant's own words. Knowing a shopper didn't repurchase is less useful than knowing they couldn't find prep instructions on the pack, called the consumer care line twice, got inconsistent answers from a customer service agent, and switched back to the old variant. That sequence tells a brand team where to intervene, turning a single data point about customer churn into a customer pain point a packaging team can fix.
Taxonomy consistency across studies
One design requirement teams underweight is question taxonomy: consistent wording for recurring themes, such as pack-instruction confusion or repurchase blockers, makes those themes trackable across quarters and segments. Different wording for the same theme breaks cross-study trend analysis, and teams end up rediscovering the same pain points repeatedly. This is precisely what a searchable insight library is built for: every coded theme connects to the ones before it, so nothing gets researched twice and deeper insights compound from one quarter to the next.
Voice of customer survey template: what to include
A usable voice of customer survey program requires three artifacts working together: a decision-focused discussion guide, a consistent coding framework, and a stakeholder-ready report template. Most efforts to collect customer feedback produce only the first, so findings often land in a deck and stop there.
The decision-focused guide should organize questions around the business decision the research must inform. Four question types do the structural work:
| Type | Example question |
|---|---|
| Context | "What brought you to this product?" |
| Reconstruction | "Walk me through your first week using it" |
| Evaluation | "What would have made that easier?" |
| Implication | "If that had worked, what would you have done next?" |
This sequence follows how memory actually works, moving from situation to behavior to judgment to outcome.
The coding framework defines themes before analysis begins, based on the decision the research must inform. If the decision concerns a reformulation, set themes like "flavor match," "prep-instruction clarity," and "repurchase intent" in advance, before analysis starts. Every coded theme should link back to the specific response that supports it, so any stakeholder can trace a conclusion to its source, the same traceability principle that governs how Conveo links every coded theme to a timestamped moment in a recording.
The report template structures findings around the decision itself: continuing the same representative scenario, open with the decision context, present prevalence data first ("42% of shoppers rate first-trial taste as worse than the original"), layer in explanation ("the primary driver is confusing prep instructions on pack, mentioned by 68% of detractors"), and close with implications. This order mirrors how product and marketing stakeholders actually process evidence.
Programs that get this template right tend to see the effect show up in service costs as much as scores: fewer repeat support interactions, fewer escalations to a customer service agent, and a customer success team spending less time firefighting corrections for otherwise satisfied customers. Reduce service costs enough this way and steps taken to improve satisfaction become a finance conversation as much as a research one, with valuable insights attached. Service teams tend to notice the shift first.
Integration requirements separate programs that influence decisions from programs that produce decks. Stakeholders act when they can move from a metric change to a recurring theme to the exact source evidence, which is why traceability requires video: a participant who hesitates before answering a pricing question, or whose tone shifts when a competitor is mentioned, produces a transcript that reads like confident agreement. Video preserves what words alone lose, which is why Conveo asks the scaled question and probes the reason behind it in the same AI-moderated session.
Feedback channels beyond the survey itself
A voice of the customer program that only runs formal surveys misses signals customers are already generating elsewhere. These feedback channels all carry direct feedback about customer needs, often before a scheduled survey wave would ever surface it:
Online reviews
Support tickets
Sales call notes
Community forum posts
The best VoC programs use a mix of feedback tools to collect feedback from these channels and route it into the same coding taxonomy used for structured survey data, so a complaint from an online review and a theme from a relationship survey get coded the same way and stay in one system.
Teams collect customer feedback to gain insights a business can act on, whether that feedback started as a scored survey response or an unprompted comment on a review site.
Closing the gap between prevalence and cause
Voice of the customer surveys tell a team a metric moved. They rarely survive contact with the follow-up question every stakeholder eventually asks: why? Closing that gap inside the same program, on the same timeline, is what Conveo's platform is built for.
Conveo asks the scaled question, whether NPS, CSAT, or CES, and probes the reason behind the answer in the same session, so the number and the explanation come from the same person. Every theme traces back to a specific participant, timestamp, and recording, so stakeholders can see the evidence for themselves.
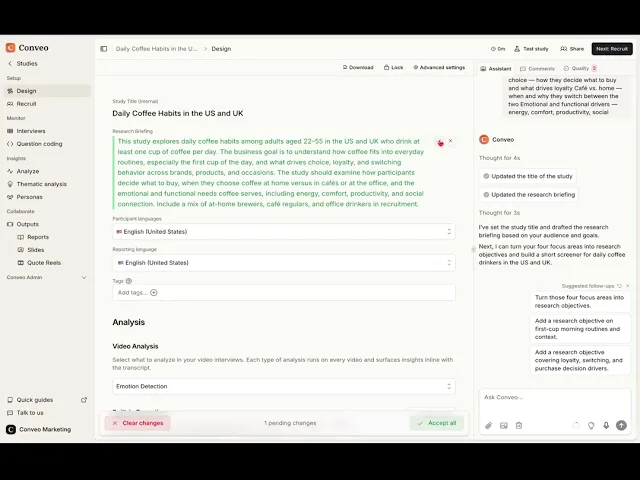
See it in action in How to build and launch a study in Conveo:
Findings don't have to expire when a study ends. Conveo StoryLines (Continuous Consumer Understanding) is a continuous, wave-based, AI-moderated research program that re-probes recurring VoC themes on a cadence, for example every two weeks or monthly, so a team isn't relying on a single snapshot to explain a metric that keeps moving. Because every coded theme lands in a searchable insight library, cross-wave and cross-study patterns stay connected and never need rediscovering each quarter, which is continuous improvement in practice: a feedback loop that gets shorter with every wave.
Closing this loop pays off well beyond the research function: improved customer satisfaction, stronger customer loyalty, and a clearer read on customer expectations heading into the next planning cycle. It requires pairing the survey with a method built to answer the question it can't, treating both as one connected foundation for lasting business success on the same research budget. A successful voice of the customer program is judged by whether it changes a decision and the business outcomes that follow, the same way the rest of market research is judged.
Conveo is built by researchers and run as research infrastructure: SOC 2 Type II certified, GDPR compliant, EU hosting (Belgium).
Frequently asked questions
Does a voice of the customer survey replace qualitative research, even with open-ended questions?
No. Surveys measure prevalence, how widespread a sentiment or behavior is. Explaining why it exists takes a different instrument. Adding open-ended questions doesn't change that without follow-up probing: unprobed responses stay at the level of sentiment ("it was confusing") instead of becoming a traceable, reconstructed experience a team can act on. That's what conversational, AI-moderated research is built for.
How often should a voice of the customer program run?
Wave-based, for example every two weeks or monthly. Conveo StoryLines is built around this continuous cadence.
What makes VoC findings actionable instead of landing in a deck?
Traceability. Every theme needs to link back to a specific participant, timestamp, and source recording, so a stakeholder who questions a finding can see the evidence instead of taking it on faith. Without that link, even valuable feedback gets treated as anecdote.
Is a consistent question taxonomy necessary across survey waves?
Yes. Without consistent wording for recurring themes, cross-study trend analysis breaks down and teams end up rediscovering the same pain points every quarter instead of tracking whether interventions work.
What is the difference between a relationship survey and a transactional survey?
A relationship survey, most often built around net promoter score, measures the overall state of a customer relationship at a point in time. A transactional survey, most often built around a customer satisfaction score or customer effort score, measures a single support interaction or purchase moment. Effective VoC surveys usually run both, since each captures a different slice of the customer experience.

About the author
Alex de Hemptinne
Head of Customer Success
Alex is a Business Impact Lead at Conveo, partnering with enterprise teams to embed AI-led research into their workflows. From the first study to full-scale rollout, she helps customers shift from project-based research to continuous customer intelligence.
Meet Alex on film →Qualitative insights at the speed of your business.
Conveo runs AI-moderated video interviews and structures everything they say.