In this article
TL;DR
Behavioral analytics shows the what, not the why. Clickstreams, website visits, drop-off rates, and sales funnel data tell you where customers turned across the entire customer journey, not what made them turn.
Surveys flatten the signal. Hesitation, contradictions, tone shifts, and the workarounds customers build around friction never surface in a multiple-choice customer feedback field.
The Conveo mechanism. AI-moderated video interviews at key journey branch points, across multiple touchpoints, capture reasoning in participants' own words.
Defensible findings. Every insight traces to timestamped video clips, so business leaders hear the reasoning rather than read a summary.
Continuous rather than episodic. Waves of research keep the map current as behavior drifts and emerging trends reshape the buying process. Teams report findings landing within days to weeks, inside the planning window.
By the time journey research comes back, the decision it was commissioned to inform has usually closed. The checkout flow shipped. The campaign launched. The team pays for that twice: once in research budget, and again in the retrofit.
That is decision-lag, and it is now a competitive variable. Velocity and hit rate on new products, marketing efforts, and channels carry real competitive advantage, and both depend on whether consumer understanding arrives while the call is still open. Customer journey analysis is where decision-lag bites hardest, because its questions sit upstream of product, pricing, and experience decisions tied to fixed ship dates and quarterly business objectives.
Behavioral customer data is what most teams reach for, because it is already there. Dashboards record every click, analytics tools log website visits, NPS captures a customer satisfaction score, and churn data confirms when someone left. All of it is precise about sequence. None of it captures the reasoning that produced the path, so teams optimize the customer touchpoints they can observe while the decision behind the turn goes unexamined. The same drop-off points then survive redesign after redesign.
When AI-moderated video interviews are run at the precise points where a journey branches, the reasoning is recorded alongside behavioral data showing where the turn occurred. That combination produces actionable insights rather than another description of what already occurred.
Why behavioral data alone leaves journey analysis incomplete
Behavioral data tells you what happened at every customer journey touchpoint: which steps users completed, where they stopped, and which channels they moved through, from social media and paid search to email, customer service interactions, and a brick-and-mortar store. Funnel dashboards help map the sequence of customer interactions. Sequence is not explanation.
| Behavioral data records | Behavioral data cannot record |
|---|---|
| The step where a customer stopped | Why they stopped at that step |
| Time spent on a pricing page | The risk they weighed and never voiced |
| A required field left blank | The workaround they invented to avoid it |
| Drop-off rate at checkout | The competing option open in another tab |
| The channel that delivered the visit | Whether what they found there matched what they expected |
One number, three possible causes. A dashboard tracking the onboarding process at a SaaS company shows 40% of users abandoning at the integration step. What it cannot tell the product team is whether users were confused by the UI, blocked by a missing permission, or had decided the integration wasn't worth the setup time. So the team optimizes what it can see: simplify the UI, add tooltips, A/B test the button. All of it misses the actual driver: users never understood why the integration mattered. None of that work moved closer to the real customer needs behind the drop-off.
Behavioral data produces optimization hypotheses. It identifies where to look; customer insights explain what to change, mapped to the specific customer journey touchpoints where the decision turned.
Why surveys flatten journey drivers
Surveys capture the customer decision journey at its most legible: stated preferences, customer satisfaction scores, and the reasons customers give for choosing one product or service over another. They collect that customer feedback efficiently at scale. The most consequential journey drivers rarely live in stated preferences.
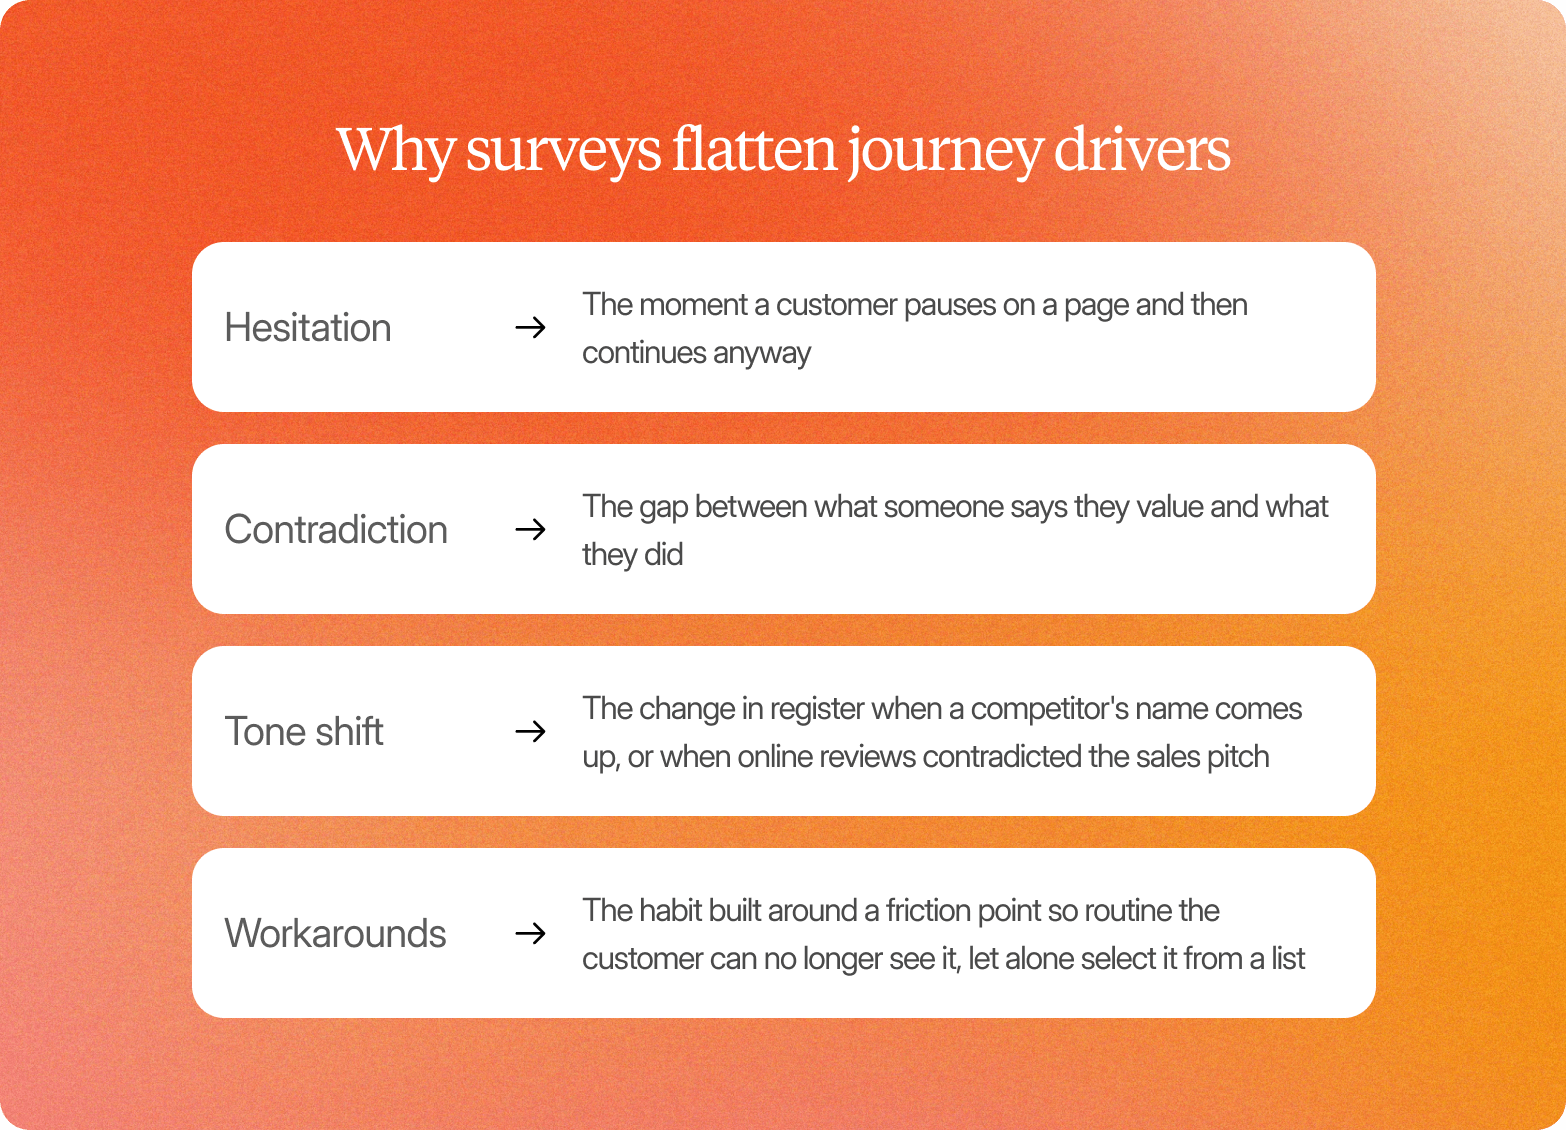
What surveys miss is everything between the decision and the explanation:
Hesitation. The moment a customer pauses on a page and then continues anyway.
Contradiction. The gap between what someone says they value and what they did.
Tone shift. The change in register when a competitor's name comes up, or when online reviews contradict the sales pitch.
Workarounds. The habit built around a friction point so routine the customer can no longer see it, let alone select it from a list.
Surveys record what customers report. They rarely capture how customers feel at the moment the decision turned, or the gap between the value customers receive and the value they were promised.
The rationalization problem. A post-purchase survey asks "Why did you choose this product?" The customer selects "Price." An interview reveals something else: they had been ready to buy from a competitor, the checkout failed twice, and they came back to the original brand. Price had nothing to do with it. The survey captured the rationalization; the interview captured the cause, and the two point at different parts of the purchasing process.
That is the flattening mechanism. Customers select from options written before the data was collected, so any driver the question design didn't anticipate never appears. If nobody predicted that a broken discount code field would drive abandonment, no participant can surface it, and no record exists of the customer expectations it violated. Survey-based journey analysis produces correlation, almost never causation. It is the wrong instrument for a causal question about the buying process, and our overview of qualitative research methods covers where each method earns its place.
How AI-moderated interviews surface the "why" behind journey turns
Conveo runs AI-moderated video interviews at the points where a journey branches, so the reasoning behind a turn sits alongside the behavioral record. Instead of mapping a drop-off and commissioning a separate study to explain it, teams capture both in one session and get a single view of the customer at that moment.
Adaptive probing follows the participant, not the script
Conveo's AI research assistant follows what a participant actually says rather than a rigid script, treating each response as the starting point for the next question. The conversation goes where the evidence leads and stays anchored in the customer's perspective. Here is how one probe sequence runs:
The participant says they abandoned a cart.
The AI research assistant asks what happened at that exact moment.
The participant explains they couldn't find the shipping cost until the final checkout step.
The AI research assistant follows up: would they have completed the purchase if the cost had been visible earlier?
The participant says yes, probably, but adds that by the time they saw the total, they had already decided to look elsewhere.
That second layer, the decision already made before the final screen loaded, is what a scripted guide misses, and it is exactly the layer that explains purchasing decisions rather than recording them.
"Absolutely sublime how the AI probes. The probing was extremely natural — I thought a human was talking to me."
Research Lead, leading healthcare research agency
Multimodal analysis captures what participants never say out loud
Conveo's analysis covers speech, tone, and facial cues, so friction registers even when participants don't name it, and each moment comes with the broader context of the surrounding conversation. Confusion at a navigation step, discomfort at a price point, hesitation before a question about a competitor: all of it surfaces in the video record. That makes video clips the primary proof format for journey break points, because they show the moment rather than describing it afterward.
Every finding links to timestamped clips and verbatim quotes stakeholders can audit directly, so they can't dismiss it as an analyst's interpretation. Because interviews run asynchronously, a team covers every branch point in a single wave rather than the handful a calendar allows.
Behavioral segmentation: recruiting for journey drivers, not demographics
Demographic profiles and off-the-shelf buyer personas tell you who completed a journey. Behavioral segmentation tells you why they turned. Recruiting by triggers, risks weighed, channels used, and workarounds adopted produces insights that map to decision moments and real customer needs, rather than target audience slices that may share no meaningful behavior.
| Demographic recruit | Behavioral recruit | |
|---|---|---|
| The brief | "Women 25 to 34" | "Customers who abandoned a cart in the last 7 days after adding at least two items" |
| What it gives you | A cohort that shares an age band | A segment sitting at one decision-relevant point in the customer buying journey |
| What the findings do | Scatter across unrelated experiences | Compound around a single friction point |
Define segment criteria before you recruit
Look in your behavioral data for the journey branch points where a measurable split occurs. Users who completed onboarding and users who dropped off at the integration step are two distinct segments, each with its own decision-making process, and recruiting across both without separating them produces findings that explain neither. Identifying the branch first ensures every segment maps to a specific question about why the customer buying journey went the way it did.
Sample size follows
Five to 15 participants per behavioral segment are typically enough to reach thematic saturation for journey drivers, because reasoning surfaces quickly when all participants share the same behavioral context. Teams do not need hundreds of interviews to identify patterns; they need the right 10 conversations with people who lived that branch. Segments built around behavior provide valuable insights about the decision itself, while a target audience defined by age and income rarely does.
Making customer journey analysis continuous instead of episodic
Customer behavior, customer expectations, and the language people use all drift within roughly six months of a journey map being completed. Channels shift, competitors move, brand loyalty moves with them, and the words customers reach for to describe friction change underneath the map. Teams then optimize for friction that has already moved, brief agencies on buyer personas that no longer hold, and present decks built on an understanding that is two product cycles out of date. The map looks credible because it was built with rigor.
Research in waves, rather than one study every 18 months
Continuous customer journey analysis runs on a cadence: monthly for high-velocity categories, quarterly for stable ones. Conveo StoryLines is the mechanism that runs those waves, and signal detection works across them, so emerging trends in how customers describe a friction point register as they form rather than at the next commissioned refresh. A journey refresh no longer requires blocking a researcher's calendar for a full fieldwork cycle.
Understanding that compounds instead of expiring
When journey research dies in a deck, the next team needing a deep understanding of the same friction point starts from scratch. Conveo's searchable insight library makes clips, themes, and verbatim quotes retrievable across studies, so teams can build a cumulative view of the customer rather than rediscovering the same drivers. Customer insights accumulate rather than expire.
A consistent coding taxonomy makes the comparison possible. When friction themes are coded consistently across waves, a team can see whether checkout abandonment anxiety is worsening, improving, or remaining stable, rather than debating whether this quarter's "payment hesitation" theme is last year's "trust barrier." Continuous interviewing brings the insight cycle inside the planning window for product roadmaps and marketing efforts alike, so findings arrive while the sprint is open and there is still time to refine messaging.
Turning journey findings into decisions: stakeholder-ready deliverables
Journey findings fail in the stakeholder meeting, not in the research. Product managers and business leaders who were not in the session cannot evaluate whether "users struggle with the onboarding process" reflects three participants or thirty, so the finding reads as opinion, and opinion gets debated rather than acted on.
Traceability changes that. When a product manager, designer, or customer success lead can watch the moment a participant abandons a flow, they are evaluating primary evidence from the customer's perspective, with the broader context of the full session just one click away. The conversation moves from "do we believe this?" to "what do we do about it?"
| What the deliverable contains | |
|---|---|
| Without traceability | "Users find the checkout process confusing." |
| With traceability | A 45-second clip of a participant saying "I couldn't figure out where to enter the discount code, so I just gave up," with a timestamp and a link to the full interview |
See what that looks like in Reading a Conveo Report:
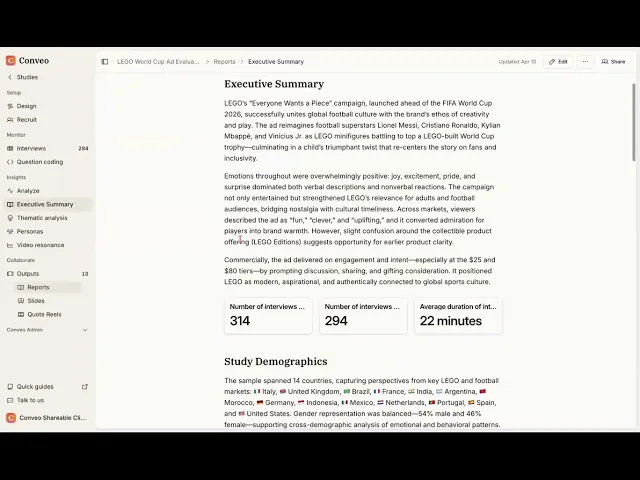
Traceable deliverables also resolve prioritization. When findings across customer journey touchpoints are anchored to clips, it becomes straightforward to identify areas where the same friction appears session after session and separate those from one-offs. Teams rank fixes by weight of evidence rather than by who argued hardest in the debrief, which is where fixing the right friction starts to drive customer satisfaction and build lasting customer relationships. Journey analysis, backed by participant evidence, produces actionable insights teams can defend, not hypotheses they have to retest.
Evaluation framework: When to use behavioral analytics, journey mapping, or interview-based diagnosis
Three approaches dominate customer journey analysis, and each answers a different question. Choosing the wrong one produces findings that cannot address what the team needs to fix.
| Approach | What it answers | What it cannot tell you | Start here when |
|---|---|---|---|
| Behavioral analytics | Which touchpoints customers visited across the entire lifecycle, where volume dropped in the sales funnel, and which paths led to conversion | Why a customer turned at a specific branch | You need to identify areas of friction in existing customer touchpoints |
| Journey mapping | Which touchpoints matter most to business objectives, and where internal processes and handoffs break down | Whether the map reflects how customers actually navigate | You need to align stakeholders on a new journey design |
| Interview-based diagnosis | Why customers turned at a specific branch, and which customer pain points produced the turn | How many customers are affected, unless paired with analytics | You need a deep understanding of why customers are turning |
Journey mapping describes the intended journey rather than the experienced one. The customer journey mapping process produces a visual representation of the entire customer experience, assembled largely from what the business already believes about itself. A well-run workshop builds alignment and a shared vocabulary, and our journey mapping guide covers how to run one that holds up. What it cannot confirm is whether customers navigate the way the map says, and the two diverge at exactly the moments that matter most.
Interview-based diagnosis captures the decision-making process as the customer lived it: what they were thinking at the moment of choice, the workarounds they invented around friction they could not name, and the logic that drove them toward or away from the next step. That causal layer makes analytics data actionable and journey map assumptions verifiable.
Run all three in sequence. Behavioral analytics identifies where the journey branches and where volume is lost. Interviews explain why customers turned there. Journey mapping aligns internal teams and internal processes on the fix once the causal evidence is in hand. Conveo closes the gap analytics and mapping leave open: AI-moderated video interviews at scale, with participants who are 68% more open than with a human moderator.
Multi-market journey analysis without a localization bottleneck
Running the same study across five markets traditionally means translating guides, briefing local moderators, managing separate fieldwork timelines, and synthesizing findings from customer interactions arriving in different languages at different times. That chain adds weeks before a single cross-market comparison is possible.
Conveo's AI moderation in 50+ languages removes the bottleneck at the fieldwork stage. Language is where most cross-market programs stall, because how customers interact with a brand in Tokyo rarely maps cleanly onto how they describe the same experience in Berlin. The same customer decision journey protocol runs simultaneously across all target markets, with the AI research assistant interviewing natively in each language and adapting probes to what participants actually say. Evidence arrives standardized, so thematic clusters and timestamped clips surface across every market in a single view, and regional stakeholders building local marketing strategies receive the evidence directly rather than four separate decks.
The gain is capability before calendar. A parallel design makes cross-market research possible at a scope most teams could not attempt before, and teams report the comparison arriving in weeks to days rather than on a country-by-country schedule, early enough in some cases to enter a launch with regional understanding in hand and targeted campaigns built around it.
4 steps to analyze a customer journey
Customer journey analysis is divided into four sequential steps that cover the key stages of the work.
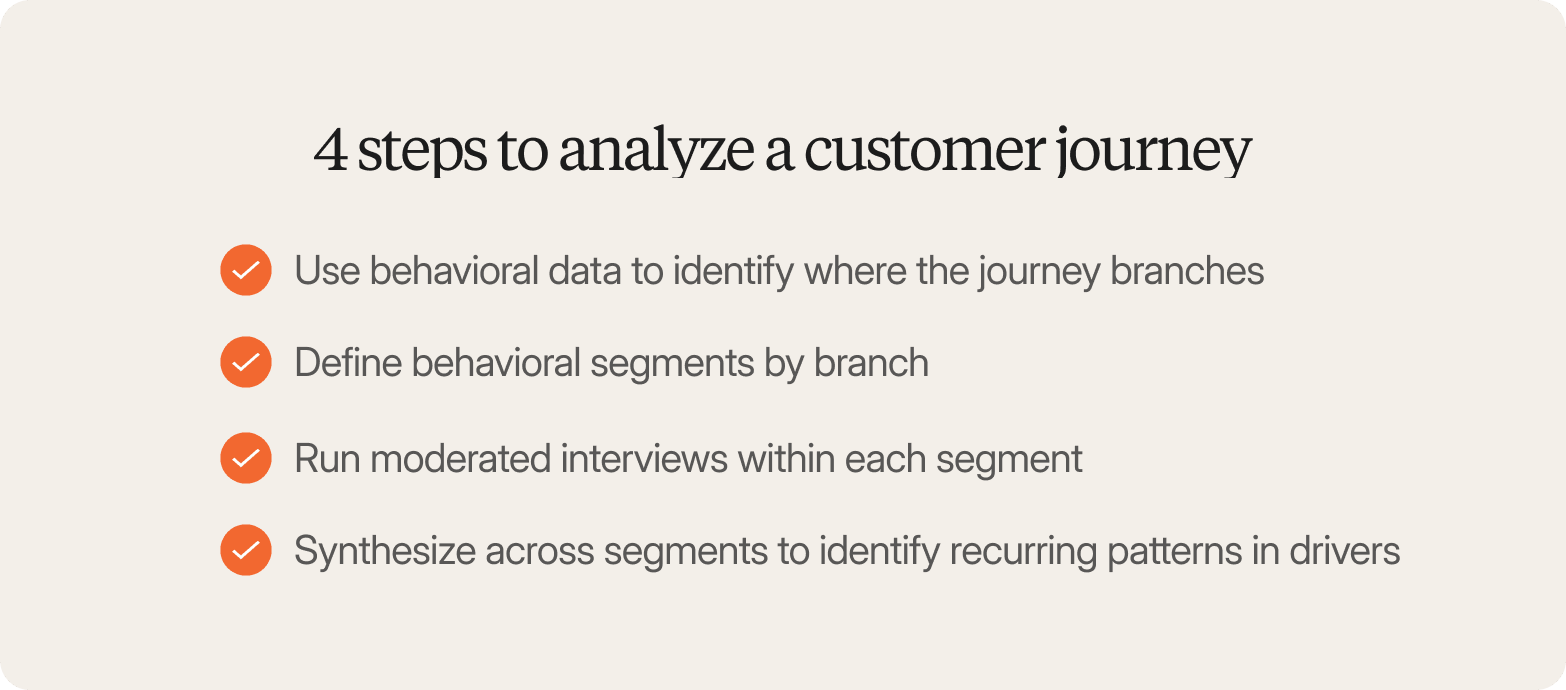
Use behavioral data to identify where the journey branches. Start with what participants do, not what they say they intend to do. Purchase paths, session recordings, website visits, social media referrals, and usage logs reveal where customers diverge. These branch points are where the real research questions live, whether they are in the consideration or purchase stage.
Define behavioral segments by branch. Group participants by the path they took. A 35-year-old and a 55-year-old who both abandoned at checkout after reading online reviews belong in the same segment here, because shared behavior predicts shared motivation.
Run moderated interviews within each segment. Surveys confirm that a branch exists but cannot explain why customers took it. AI-moderated interviews surface the reasoning, the hesitation, and the unmet need behind the pattern.
Synthesize across segments to identify recurring patterns in drivers. The goal is a ranked understanding of which moments determine the outcome, so the team knows where to act first. Those drivers are also the raw material for compelling messaging, because they arrive in the language customers used themselves.
Why Conveo fits customer journey analysis
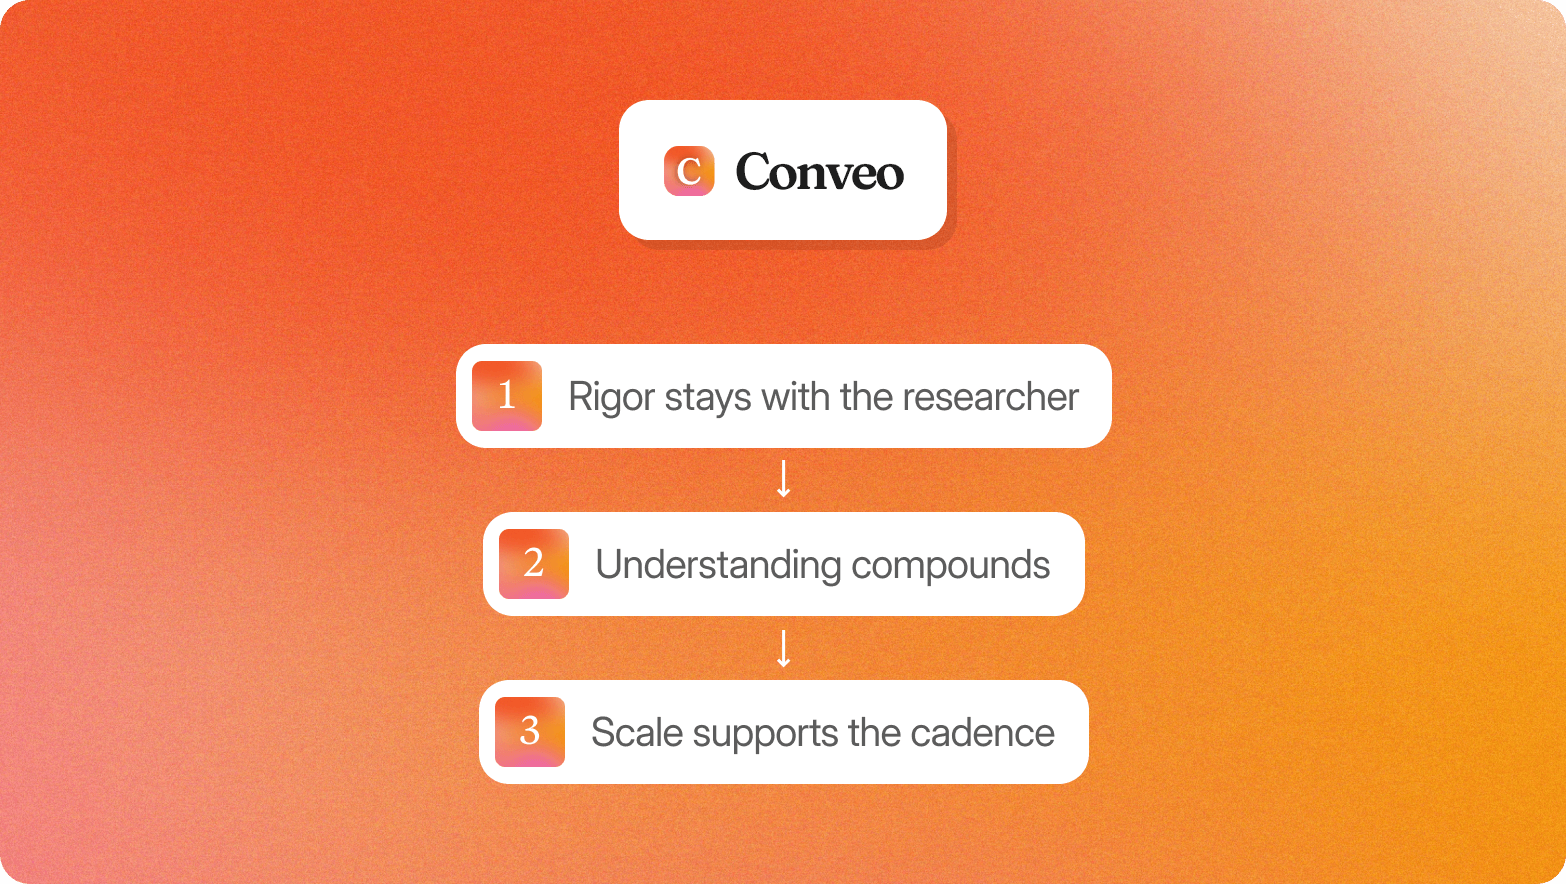
Continuous, not episodic
Teams work from continuous consumer understanding rather than a study every 18 months: waves of AI-moderated interviews at the branch points that matter across the entire customer journey, running while product and marketing decisions are still open. Decision-lag closes because the evidence is in hand when the question arrives, and closing it is where the competitive advantage sits.
Rigor stays with the researcher
Researchers maintain control over the design, segment definitions, and interpretation, while Conveo's AI research assistant handles the operational load of volume moderation. Every finding traces to a timestamped clip and a verbatim quote, so stakeholders audit primary evidence rather than a summary.
Understanding compounds
The searchable insight library keeps clips, themes, and quotes retrievable across studies and waves, coded on a consistent taxonomy spanning the entire customer lifecycle. The second journey study starts from what the first established.
Scale supports the cadence
Interviews run asynchronously, so teams hold 10 to 1,000 conversations simultaneously, and findings land inside the planning window, in weeks to days as teams report.
Frequently Asked Questions
What is customer journey analysis?
Customer journey analysis is the practice of examining the entire customer journey, from initial awareness through purchase, retention, and advocacy, to understand what drives purchasing decisions and where friction occurs in the purchasing process. It combines customer data with qualitative evidence: what customers did, and what they actually meant by it. Without the qualitative layer, teams can see where people drop off but cannot explain what to change.
What are the standard stages in a customer journey?
Most frameworks follow five key stages, in which a potential customer recognizes a need, evaluates the options, chooses a product or service, uses it, and then decides whether to stay: 1. Initial awareness: the need becomes conscious. 2. The consideration stage: options get compared. 3. The decision or purchase stage: one option wins. 4. Retention: the product holds up in use, or does not. 5. Advocacy: the customer recommends it, or quietly stops. Specific customer touchpoints, emotions, and pain points are present in each phase. Teams often collapse post-purchase into a single retention stage, which obscures the details that matter most across the entire customer lifecycle: onboarding, customer service interactions, customer success check-ins, renewal, and customer loyalty programs. Some teams call the pre-purchase portion the buyer's journey, though that split obscures how much of the buying process is shaped by the last experience someone had.
What is the difference between customer journey mapping and customer journey analytics?
Journey analytics is quantitative: it identifies where customers drop off and which paths convert across multiple touchpoints. The customer journey mapping process is qualitative: it produces a visual representation of the entire customer experience, covering what customers think and how customers feel at each stage. Analytics surfaces the where; qualitative research, including AI-moderated interviews, surfaces the why. Teams relying on analytics alone can identify a problem but often cannot diagnose it well enough to fix it confidently.
How does qualitative research fit into customer journey analysis?
Qualitative research fills the gap behavioral data cannot close. Surveys and analytics show patterns across large samples but cannot explain the reasoning behind a decision, the hesitation before a purchase, or the frustration that precedes churn. AI-moderated video interviews conducted at key stages give teams verbatim language, tone, and context, turning directionally interesting observations into valuable insights that stakeholders can trace to a real person. Done consistently, that connects journey work to the outcomes teams are accountable for: higher customer satisfaction, customer loyalty, and lifetime value.
What platforms are used for customer journey analysis?
Customer journey analysis draws on three categories of platform. Behavioral analytics platforms track where customers went and where they dropped off across all the customer touchpoints in a funnel, without capturing why they turned. Journey mapping platforms visualize the intended journey and align teams internally, but they represent a hypothesis rather than a measurement of how customers navigate. Interview-based diagnosis platforms like Conveo run AI-moderated video interviews at the points where a journey branches, so the reasoning sits alongside the behavioral record.

About the author
Florian Hendrickx
Head of Growth
Florian is Conveo’s Chief Growth Officer, leading growth strategy and go-to-market execution as the company scales. He’s held growth leadership roles at companies like Deliverect, Robovision, and Aikido Security, and brings hands-on experience across marketing, sales, and product.
More by Florian →Qualitative insights at the speed of your business.
Conveo runs AI-moderated video interviews and structures everything they say.