In this article
TL;DR
Best for: Teams who need to move beyond what clickstream data can tell them about a customer's digital journey.
By the time a journey insight arrives after the decision is already locked into the roadmap, the campaign brief, or the redesign, it might as well not exist. That lag is what's costing teams the fix.
Analytics shows every click but cannot explain why customers hesitate, open a second tab, or abandon at checkout, or what customer needs drive the behavior underneath it. The behavior is visible. The reason is not.
This guide provides a framework for closing that lag: capturing the actual tradeoffs, hesitations, and offline influences that shape decisions, using traceable qualitative evidence, before the decision window closes.
AI-moderated video interviews, structured conversations where an AI research assistant adapts its questions to what each participant actually says, fill the gap analytics leaves open, letting participants explain their reasoning in their own words, on their own schedule, across 50+ languages.
A checkout drop-off, a stalled onboarding flow, a campaign that underperformed against every pre-launch signal: by the time most teams understand why, the decision that caused it has already shipped. The next sprint starts from the same uncertain foundation the last one did, still guessing at customer needs instead of confirming them. That gap between when a decision closes and when the understanding needed to make it well actually arrives is decision lag, and it is the real cost center in journey optimization work.
Most teams have plenty of data. What they're missing is the customer's perspective: the reasoning behind why they hesitated, switched channels, or walked away, delivered while the decision is still open.
Why analytics alone cannot diagnose digital journey breakdowns
Clickstream data tells you where people stopped. It does not tell you why.
A drop-off at the payment screen looks the same whether the customer:
encountered a confusing form field
saw a shipping cost they weren't expecting
quietly opened a competitor's site in a second tab to compare prices before abandoning both
Every one of those exits registers identically in your analytics dashboard: a lost conversion, a broken digital customer journey, and no explanation you can act on.
This is the diagnostic gap analytics alone cannot close: the data captures behavior without intent, making it difficult to identify gaps between what a dashboard shows and what actually happened. Teams infer reasons from patterns instead: a checkout spike suggests friction, a product-page spike suggests bad imagery. Those are educated guesses that drive A/B tests optimizing for the wrong variable, without ever confirming the actual customer pain points behind the pattern.
Survey intercepts add some signal, but they arrive too late. By the time a post-session prompt appears, the moment of hesitation has passed, and participants reconstruct rather than report live, flattening the nuance that actually explains the decision. The trust concern that surfaced while reading online reviews, the offline conversation that overruled an in-progress purchase, the price comparison running in another window: none of that appears in a survey response written three minutes later.
Qualitative research on the digital customer journey exists to surface exactly this layer. AI-moderated video interviews are structured conversations where an AI research assistant adapts its follow-up questions to what each participant actually says, rather than firing the same script at everyone. When participants describe their experience in their own words, in real time or close to it, the second-tab behavior becomes visible, the hesitation gets named, and the offline influence enters the record. That's what it means to analyze user behavior rather than just log it: the evidence base that makes behavioral data interpretable, without which optimization decisions rest on inference rather than understanding.
The evidence gap in digital customer journey optimization
A checkout page with 60% abandonment is a fact. What it means for the product or the pricing decision is not in the data: was it the form length, the shipping cost, a trust signal, or something the customer weighed that never showed up in the UI? Without participant truth, the answer is a bet, and a wrong diagnosis produces a wrong fix. A team that redesigns a form when the real customer pain point was unspoken price anxiety ships a change that never moves the number, and the next sprint starts from the same uncertain foundation, decision lag compounding on itself.
Conveo's AI research assistant adds the reasoning behind observed digital behavior, so a drop-off in the digital customer journey can be explained by what the customer was weighing rather than simply where they stopped. Run against the specific customer touchpoints where behavioral data shows friction, these conversations surface what analytics cannot: the competing option being compared, the concern never articulated, the moment the value proposition stopped holding.
Research methods for digital journey diagnosis: a decision framework
The right research method for a digital customer journey question depends entirely on what you're trying to diagnose. Some questions are really about user behavior alone (what happened, in what order); others are about the reasoning behind it. Drop-off rates, navigation confusion, trust barriers, and channel-switching behavior each call for a different instrument. The wrong one slows you down and produces data that can't answer the question you're actually asking.
The table below maps five common methods against what matters most for digital journey diagnosis: question type, speed, relative cost, traceability, and required sample size. Each row is a different way of collecting data on customer behavior; what varies is what each method can explain, beyond simply what it can count.
| Method | Question type | Speed | Relative cost | Rigor / traceability | Typical sample |
|---|---|---|---|---|---|
| Web / behavioral analytics | What (behavior, volume, drop-off location) | Hours | Low | High for behavior; zero for intent | Thousands |
| Surveys | What + surface-level why | Days | Low to medium | Low (no source evidence) | Hundreds |
| AI-moderated interviews | Deep why (motivation, confusion, trust, emotion) | Days | Medium | High: verbatim, video, adaptive probing | 20 to 100+ |
| Diary studies | Longitudinal why (channel switching, evolving friction) | Weeks | Medium to high | High: timestamped, in-context | 10 to 30 |
| Usability tests | Task-specific why (navigation, interface confusion) | Days to weeks | Medium | High: observed behavior with verbal protocol | 5 to 20 |
How to read this table. No single method covers the full picture:
Analytics tells you where customers leave; it cannot tell you why.
Surveys can surface a pattern, but without source evidence, findings are difficult to defend once multiple stakeholders start asking where the number came from.
Usability tests pinpoint interface-level friction but require scheduling and moderation that add time.
Diary studies capture behavior across the full journey arc, but the recruitment and longitudinal commitment push timelines out.
AI-moderated interviews occupy a distinct position in this matrix: built by researchers to answer the deep why questions analytics and surveys cannot reach, with the rigor of verbatim quotes, video evidence, and adaptive probing that follows what a participant actually says rather than a fixed script. That rigor makes findings defensible in a stakeholder review, and it also answers the standing objection that qual takes too long for a decision shipping this quarter. That was true when qual meant scheduling a dozen sessions across three weeks and synthesizing by hand; it stops being true when asynchronous conversations run overnight and arrive with verbatim quotes, video timestamps, and thematic analysis already structured. The constraint was always operational.
For most digital customer journey questions, the practical starting point is analytics to locate the friction, then AI-moderated interviews to understand it. Diary studies add value when the question spans multiple touchpoints or channels over time; usability tests are the right call when the hypothesis is already specific enough to test a particular interface interaction.
What to study, who to recruit, what to ask
The most common failure in digital journey research is treating the whole journey as one question, when each stage produces a different type of evidence that the discussion guide needs to reflect.
Study design: what to research at each stage
Here is how to structure the evidence layer across a standard four-stage journey, with post-purchase spanning both the retention and advocacy stages referenced later in this piece:
| Journey stage | Primary research question | Evidence type needed |
|---|---|---|
| Awareness | How did they first encounter the category or brand? What triggered active search? | Verbatim quotes capturing the inciting moment; theme prevalence across segments |
| Consideration | Which sources did they consult? What criteria did they apply? Where did they stall? | Video clips showing hesitation or emotional tone shifts; verbatim comparisons |
| Decision | What finally moved them? What nearly stopped them? | Timestamped video clip of the moment of resolution; verbatim on the deciding factor |
| Post-purchase | Did the experience match the expectation? What would make them leave or advocate? | Theme prevalence across cohorts; verbatim on unmet expectations |
Each cell in that table represents a traceable evidence standard: every claim on the final journey map links back to a real participant, a video clip, or a theme prevalence figure that quantifies how widely it holds. That traceability is what separates a research-grade journey map from a stakeholder assumption presented in a nicer format.
Who to recruit
Recruit against behavioral segments; demographics alone rarely capture them. A lapsed buyer and an active loyalist may share the same age and income bracket while describing entirely different journeys. For each meaningful customer segment, 5 to 15 participants surfaces consistent patterns: fewer risks idiosyncratic responses dominating the themes, and more usually means you're confirming rather than discovering, a different research objective.
Behavioral screeners matter more than profile matching here. Prioritize participants who completed the journey recently, ideally within 60 to 90 days, so recall is specific rather than reconstructed, whether you're recruiting existing customers repeating a familiar path or new customers experiencing it for the first time.
What to ask
Build the discussion guide chronologically: open with the inciting moment, walk through each stage in sequence, and probe on friction and emotion at every transition. The most useful questions are retrospective and specific, "Walk me through the last time you..." rather than "What do you generally do when...", since retrospective specificity surfaces the actual decision logic rather than the idealized version participants think they should describe. What nearly stopped them at consideration is often more strategically valuable than what completed the decision.
Behavioral segmentation for digital journeys
Demographics tell you who someone is. They do not tell you why that person abandoned a cart, switched channels mid-consideration, or bought from a competitor at the last moment. Two consumers with identical age, income, and household size can take completely different paths through the same omnichannel customer journey because the decisions driving each step are behavioral: one is triggered by a peer recommendation and moves fast, the other weighs risk carefully, reads three online reviews, calls the customer service team, and only converts in a physical store. A buyer persona labeled "tech-savvy 7/10" describes neither of them accurately enough to act on.
Behavioral segmentation asks what someone does, and more importantly why they do it at each stage. For journey research, four dimensions actually predict path differences:
The trigger that initiated the journey: a life event, a customer pain point, a cue picked up on social media platforms
The risks participants weighed before committing
The channels they used, and in what sequence
The workarounds they invented when the expected path broke down
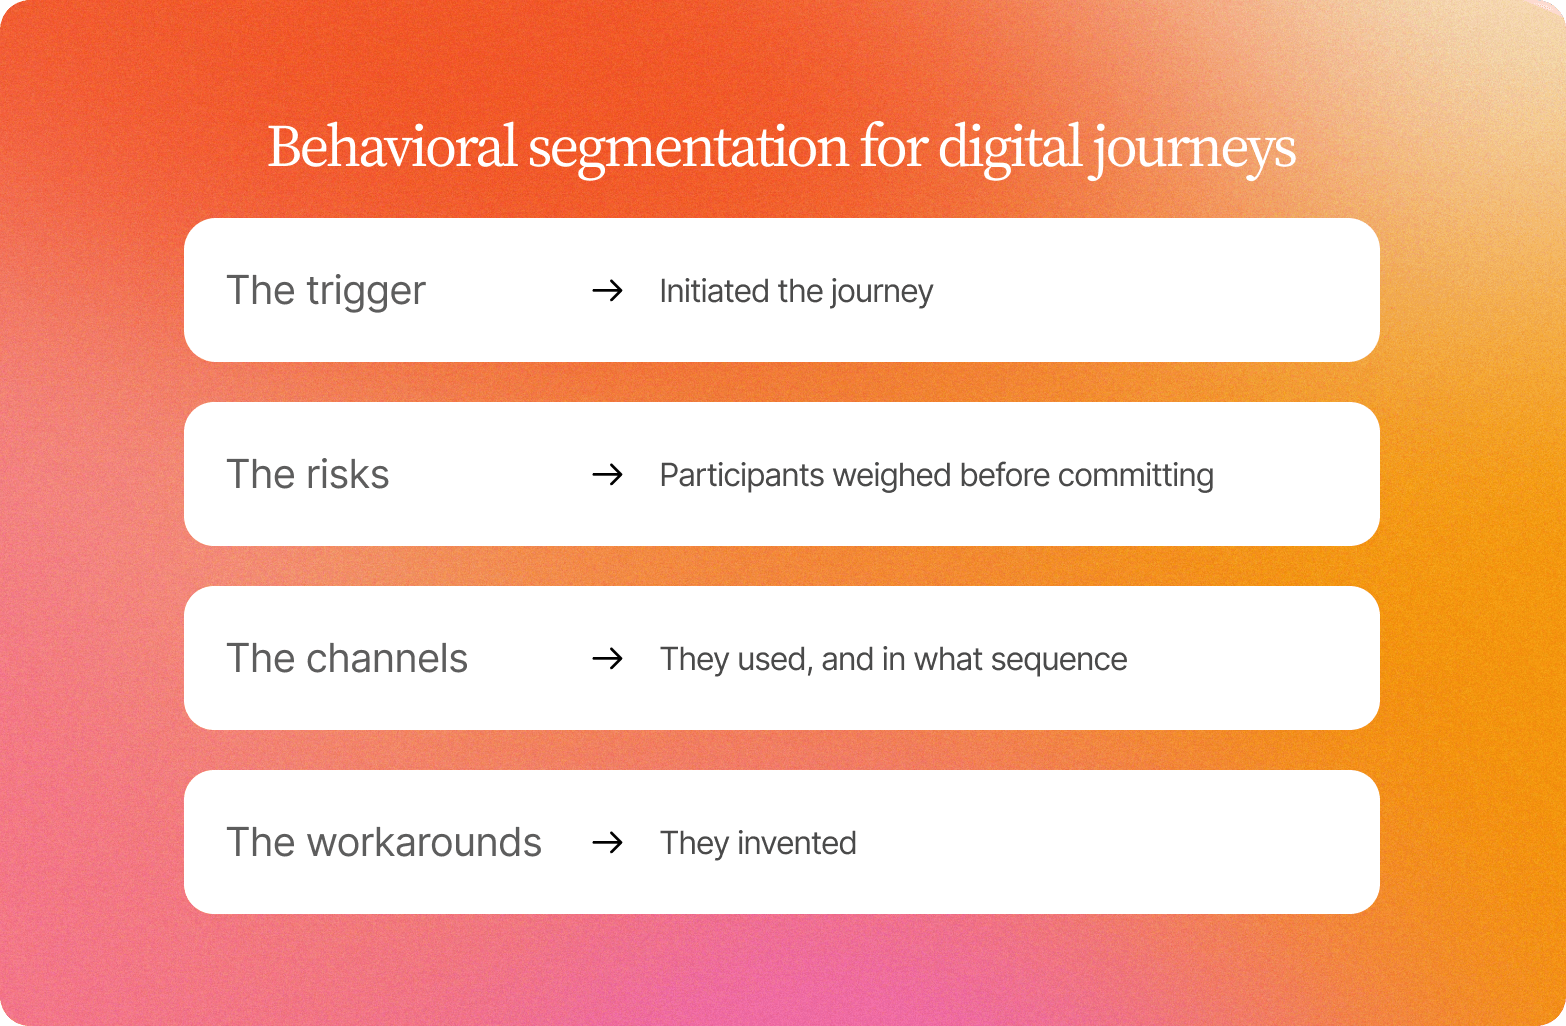
That last dimension, the workaround, is where the most actionable insights tend to live, because it reveals where the designed journey and the lived journey diverge.
The practical implication for study design: recruit by behavioral profile rather than demographic proxy, defining segments around the trigger and decision context rather than a generic slice of the target market. A customer segment might be "first-time category buyers who started online but converted offline" rather than "women 35 to 49."
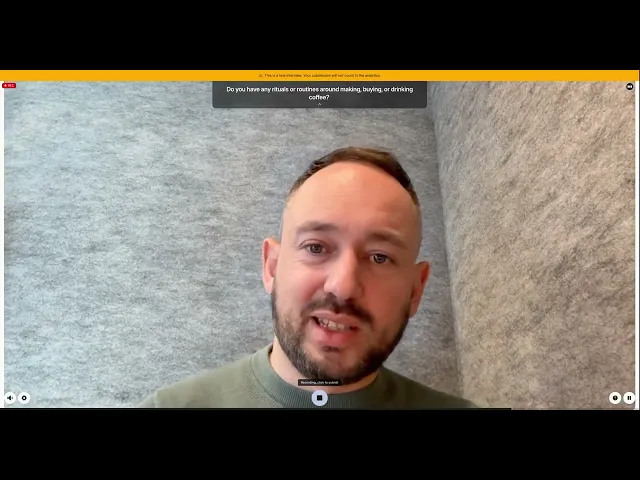
Conveo's AI research assistant applies this logic inside the interview itself, adapting its probes based on what each participant reveals about their own trigger and decision context, so segment differences surface through the conversation rather than being imposed by the screener. The result is behavioral texture that demographic cuts would never surface, texture that feeds into detailed buyer personas and helps teams gain insights into which segments, including high-value customers, deserve closer attention. Some teams label these customer personas rather than buyer personas; the name matters less than whether the persona is built from what people actually did.
See how Conveo probes for trigger and decision context:
Continuous digital journey understanding: why the map keeps going stale
Most journey maps live as a finished document: a workshop output, a slide in a deck, a PDF shared with leadership and then quietly left alone, while the digital customer journey it describes keeps moving, driven by changes to the product or service, market shifts, and evolving customer needs. A map built in one quarter is often navigating with the previous quarter's assumptions by the time a campaign goes live.
Why the project-based model breaks down
The operating model most teams run today is project-based: a leadership request or annual planning cycle triggers a study that takes weeks to deliver a journey map, which then gets archived. Months pass, behavior drifts, the map stays the same, until something breaks (a campaign underperforms, churn spikes) and the cycle repeats. The gap between "map delivered" and "map still accurate" is where decisions go wrong.
The continuous alternative
The alternative is a continuous cadence, structured in waves rather than one-off commissions: a standing program with defined journey stages and recurring participant cohorts runs a wave, delivers valuable insights, and tracks new themes against the last wave when a trigger occurs: a product launch, a channel shift, a segment entry, an anomaly in the data. Contradictions get flagged instead of buried, and nothing gets researched twice, because every wave feeds a compounding, searchable insight library any team can draw from.
This is the always-on model Conveo StoryLines is built for: the continuous research engine behind Conveo's positioning as Consumer Understanding Infrastructure: a wave-based, AI-moderated research program with a Continuous Consumer Understanding cadence, run, for example, every two weeks or monthly per market, depending on a team's specific business model. It keeps a standing read on how behavior, expectations, and friction points shift across multiple touchpoints, updated before the drift becomes visible in performance data.
"The analysis is instantaneous. I can synthesize all the data, and also go back and watch every interview. You can ask it to challenge your own thinking. It's so easy to talk to your data."
Dafydd Jones, Associate Director, Ninth Seat
In this model, the digital customer journey becomes a living read of what's actually happening, with the marketing team, product, CX, and innovation teams pulling from the same compounding library and comparing notes, rather than the journey map belonging to whoever commissioned it. The payoff is a more positive customer experience at moments that used to go unnoticed until a quarterly review caught them, and it's what makes personalized customer journeys possible at scale: teams reacting to how a segment is actually behaving this quarter.
Enterprise governance for journey research data
When omnichannel customer journey research reaches the executive review stage, credibility hinges on one question: how do we know? A finding without a traceable source is an opinion, and opinions get challenged in procurement reviews and board-level strategy sessions. Evidence survives.
Conveo builds traceability into every layer of the research process. Each insight connects back to a timestamped video clip and verbatim quote from a real participant. Multimodal analysis lets research teams see what transcripts miss:
the hesitation before answering a price question
the tone shift when a friction point surfaces
the non-verbal signals that confirm or contradict what was said aloud
When a stakeholder asks why a journey stage is underperforming, the answer comes with a video clip.
Conveo is built by researchers, and that shows up in how studies are designed and findings are synthesized, separating traceable insights from the AI-generated summaries procurement teams rightly distrust.
Governance infrastructure removes the procurement barrier before it becomes one. Conveo's credentials include:
SOC 2 Type II certification
GDPR compliance
EU hosting (Belgium)
For teams tracking customer retention across the customer lifecycle in multiple markets, these credentials travel with the study rather than requiring separate validation per region.
Multilingual comparability is handled within the same platform: AI-moderated interviews run across 50+ languages with consistent probing logic, so a journey insight from a German participant and one from a US participant are structurally comparable rather than simply translated.
How AI-moderated interviews close the loop on digital journey friction
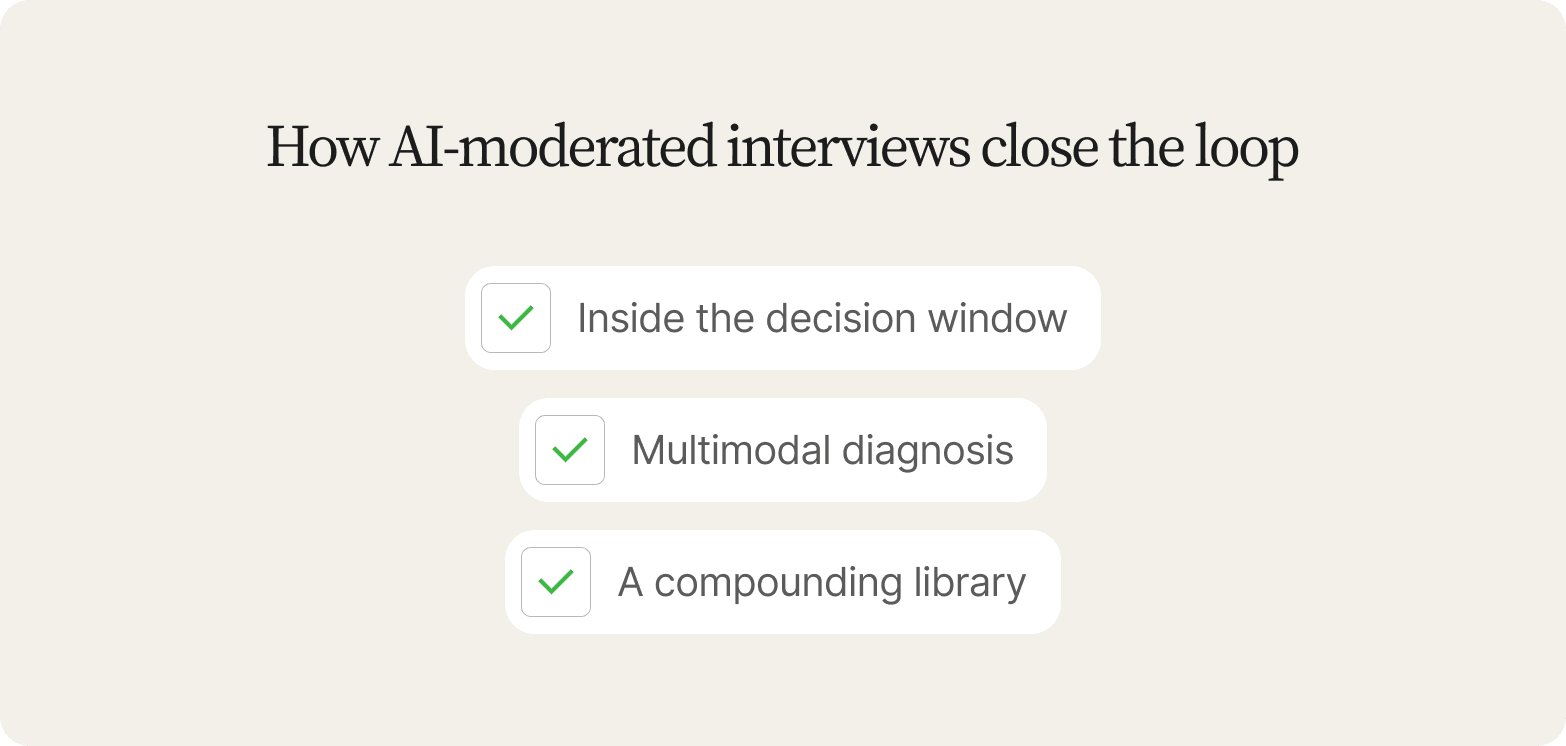
When an ecommerce customer journey shows a drop-off at checkout, analytics can tell you the step where it happens. What it can't tell you is whether the customer hesitated because the shipping cost felt unexpected, because a form field triggered distrust, or because the payment options didn't match their expectations. That distinction is the difference between a fix that works and one that moves the problem downstream.
Inside the decision window
Because sessions run asynchronously, teams running Conveo studies can field 100 interviews in 3 days, without the scheduling bottlenecks that make traditional depth interviews impractical at scale. Conveo's AI research assistant responds to what participants actually say, following hesitation with a follow-up and probing a tone shift the moment it appears. That keeps the insight inside the decision window, where it can still influence the build.
For ecommerce businesses trying to retain customers past a single purchase, that speed matters as much as the depth: findings that would once have arrived after the fix already shipped now arrive while there's still a decision to make.
Multimodal diagnosis
Conveo's multimodal analysis adds a layer transcripts alone can't provide: research teams see speech, tone, and facial cues together, surfacing the moment a participant's expression shifts at a price point or their voice flattens on a form. For teams diagnosing conversion loss on a complex ecommerce customer journey, this moves the diagnosis from "step three has high drop-off" to "participants show distrust signals when unexpected fees appear," making it possible to address pain points at the exact step where they occur, rather than redesigning the wrong screen.
A compounding library
What makes this compound over time is the searchable insight library, one that spans the entire customer journey rather than a single touchpoint. Journey learnings from one study connect to the next, so a team revisiting checkout friction six months later retrieves prior clips, themes, and verbatims rather than commissioning fresh research. The understanding builds instead of resetting, closing decision lag for good: the second study starts ahead of where the first one ended.
That compounding effect is the practical case for running this kind of program long term: teams spend less time re-litigating what's already known and more time acting on it, which is where it starts to show up in business growth. Explore how Conveo keeps study design through synthesis in one place.
Frequently asked questions
What is the digital customer journey?
The digital customer journey is the complete sequence of customer interactions a brand has across online channels, from first discovery through post-purchase advocacy, covering every customer touchpoint where intent forms or shifts: search engines, social media, website visits, email, in-app experiences, and support. What makes it distinct is the volume and variety of those touchpoints and the expectation that context carries across every channel switch. Understanding why the customer journey is important comes down to this: gaps between what customers experience across the entire customer journey and what brands assume they experience are where conversion, customer retention, and customer loyalty are lost.
What are the stages of the digital customer journey?
The digital customer journey runs through five stages: awareness, consideration, decision, retention, and advocacy. At awareness, potential customers discover a brand through search engines, social media platforms, or referral. Consideration is evaluating options across sessions and devices. Decision converts intent into a completed purchase process, and the customer journey continues well past that point through retention (onboarding, repeat engagement, support) and advocacy, when loyal customers recommend the brand through word-of-mouth referrals. That's the reality of a typical customer digital journey: customers rarely move through these stages in a straight line, looping back and jumping stages depending on the category, the price point, and how well the brand maintains continuity across channels.
How does an omnichannel customer journey differ from a multichannel one?
An omnichannel customer journey connects every channel so context and progress carry across each interaction, no matter how customers interact with the brand or where they switch. A multichannel approach just means presence on multiple channels, without guaranteeing those channels share data or hand off context. The distinction shows up when a customer researches on mobile, visits the website on desktop, and contacts the customer service team by phone: multichannel treats these as separate events, omnichannel treats them as one conversation. The gap is where most customer frustration originates, and it's usually a sign a business needs to identify gaps in how its channels connect before revenue loss gets misattributed.
What does ecommerce customer journey mapping involve?
Ecommerce customer journey mapping documents every touchpoint a shopper encounters from brand awareness through post-purchase customer engagement, identifying where friction causes drop-off. A useful map records the stage, channel, customer's emotional state, purchase history where relevant, and the action taken at each point. For ecommerce businesses, the most consequential touchpoints cluster around the decision stage: product pages, checkout flow, payment options, and cart abandonment triggers. Mapping reveals blind spots analytics alone misses: knowing that 30% of carts are abandoned tells you there's a problem, knowing why requires talking to the customers who left.
What is customer journey optimization and how do you approach it?
Customer journey optimization is the ongoing practice of improving each stage of the digital customer journey so more customers move through it with less friction and greater satisfaction. It starts with mapping the current journey against actual customer behavior, identifying where the experience breaks down, and prioritizing fixes by impact. Common intervention points include reducing checkout friction, improving onboarding for better customer retention, and closing the gap between what digital marketing promises and what the product or service delivers. Marketing strategies built on assumption engage customers less effectively than ones built on evidence. The most durable customer journey strategy treats customer understanding as continuous input rather than a periodic audit, so changes that boost satisfaction happen before the drop shows up as revenue loss.
How do you measure the success of a digital customer journey?
Measuring the success of a digital customer journey requires tracking key performance indicators at each stage, usually pulled from a source like Google Analytics alongside a platform's own dashboards: reach and engagement at awareness, time on site and customer engagement at consideration, conversion rate and cart abandonment at decision. Retention is measured through repeat purchase rate and churn; advocacy through net promoter scores and referral volume, both leaning heavily on customer feedback collected directly rather than inferred from behavior. Quantitative data shows what happened; customer journey optimization requires qualitative research to explain why, so teams fix the right things rather than optimize metrics in isolation.

About the author
Hendrik Van Hove
Founder & CPO
Hendrik is Conveo’s Chief Product Officer and co-founder. He's extremely passionate about technology and the real positive impact it can bring. Before Conveo, he ran AI strategy projects at McKinsey for the Fortune 2000, working with boards and every function from marketing, to sales to insights.
More by Hendrik →Qualitative insights at the speed of your business.
Conveo runs AI-moderated video interviews and structures everything they say.