In this article
TL;DR
Best for teams that need to weigh severity alongside frequency: Most voice of customer analysis workflows treat all customer feedback the same way, surfacing what customers mention most often over the pain points that actually drive decisions. High-frequency minor complaints routinely outrank low-frequency deal breakers because the methodology has no severity layer.
Best for researchers who need traceable findings: This guide provides a framework for weighting consequence alongside volume, turning raw feedback into actionable insights, with voice of customer examples drawn from concept testing, brand tracking, and continuous discovery programs.
Best for insights teams moving from periodic to continuous VoC: Tone, hesitation, and probing depth are the mechanisms that capture customer sentiment: how much something matters, on top of how often it's raised. That distinction is what separates a theme count from a decision-ready finding.
Analysis is the stage of a voice of the customer program where feedback turns into decisions, which is why it needs the same rigor as collection.
Why voice of customer analysis arrives too late to matter
A quarterly VoC study lands in January. The brand team makes its positioning call in February. The finding that would have changed the conversation arrives three months after the decision window closed. That's the real cost of most VoC programs, and it compounds with a second problem: even on-time findings are often ranked wrong. Get the cadence wrong, and even a well-designed customer program starts working against the business it's meant to serve.
Most VoC analysis defaults to theme counts: teams analyze customer feedback by counting mentions, without weighting what each one predicts.
A complaint mentioned by 35% of participants ranks above one mentioned by 12%, regardless of how each actually affects behavior.
A packaging irritation raised by 40% of participants sits above a fundamental product flaw raised by 8%, because the workflow has no way to weight severity.
Volume masquerades as signal, and teams spend a quarter fixing friction that shows up often while the deal breaker that drives customer churn goes unaddressed. Left unaddressed long enough, that same deal breaker erodes customer loyalty and customer retention long before anyone notices the pattern in a dashboard, the kind of erosion that shows up as fewer renewals and lower customer lifetime value.
The fix is a severity layer: a way to prioritize customer data by what it predicts, paired with a timeline that keeps pace with the decision it's meant to inform.
What severity-weighted analysis measures that frequency counts miss
Severity-weighted voice of customer analysis reads the signal behind the mention: how much hesitation preceded it, whether tone shifted when the topic came up, whether the response ran longer than average. A research team running AI-moderated interviews can capture all three signals in the same session, scoring each theme by how often it appeared and by the intensity with which participants expressed it, alongside the behavioral data an AI research assistant captures on pacing and pauses.
The practical outcome: when a low-frequency issue carries high emotional intensity, it surfaces at the top of the analysis instead of disappearing into the long tail. A CMI leader walking into an executive review can point to a specific participant and a specific reason a theme ranks where it does, with no need to defend a frequency-ranked list they can't fully stand behind. That's the difference between valuable feedback and noise: what it signals about customer behavior once you weight it correctly, and where fixing it will actually improve customer satisfaction and retention, matters more than how often it was said.
Traceability is what makes that defense possible. Every claim should link back to a specific participant, a verbatim quote, a timestamp, and a video clip. When a stakeholder asks, "Where did this come from?" and the answer is a slide deck citing a report that summarizes a transcript no one can locate, the finding doesn't survive the question. An unsourced summary is an opinion with a sample size attached.
What to measure in voice of customer analytics
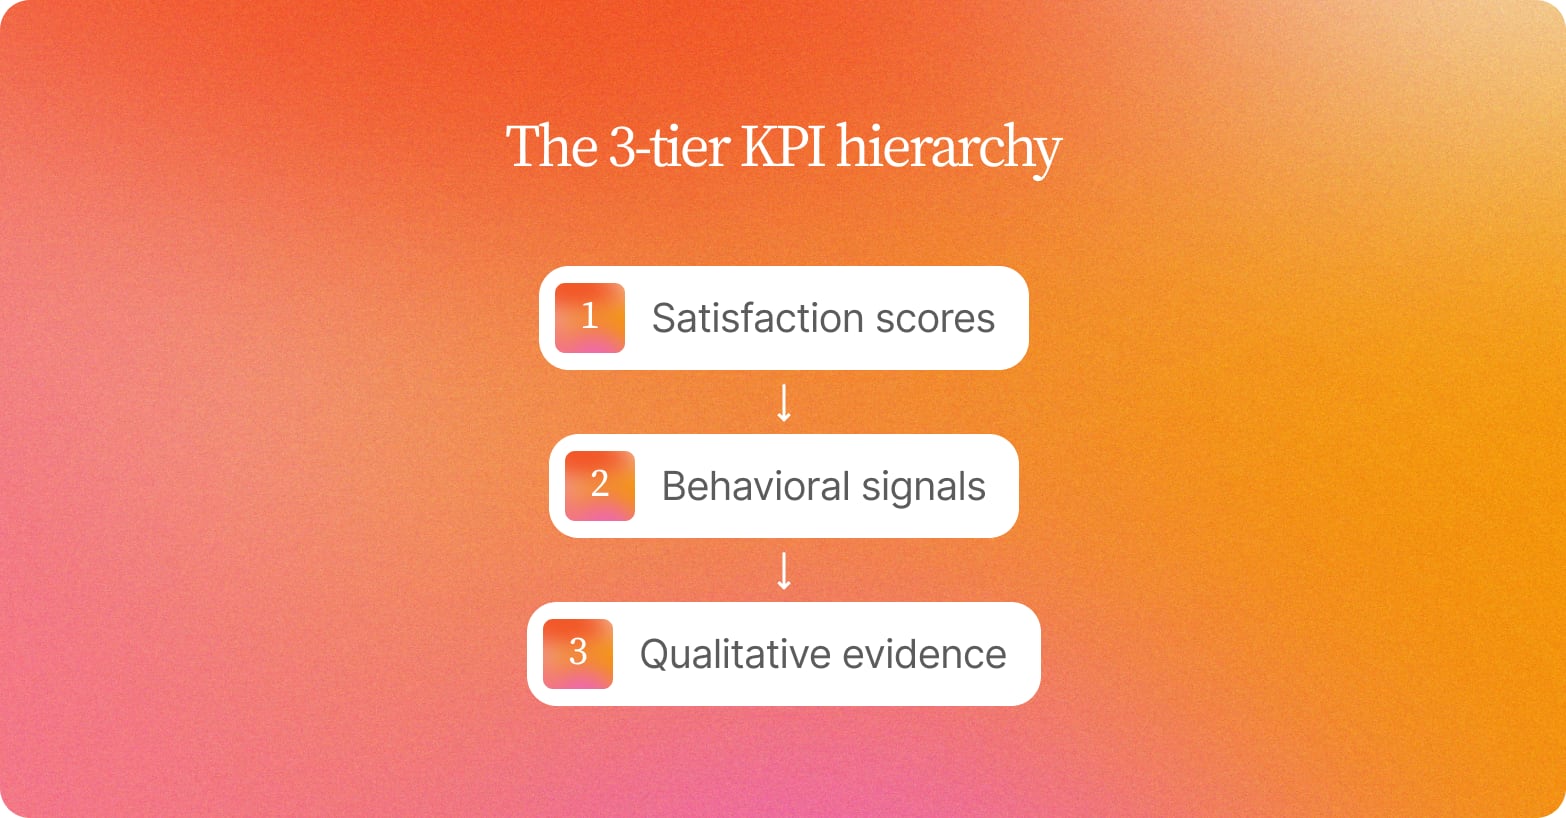
A three-tier KPI hierarchy assigns each measurement layer a specific question to answer, so the answer at one tier sharpens the question at the next.
| Tier | Question answered | Output |
|---|---|---|
| Tier 1: Satisfaction scores (NPS, CSAT, CES) | How do customers feel right now? | A number that flags where to look |
| Tier 2: Behavioral signals (churn rate, repeat purchase rate, support contact volume, renewal rate) | Are customers acting on that feeling, and is it affecting the business? | Confirmation that the feeling is real |
| Tier 3: Qualitative evidence (recurring themes, verbatim quotes, video-recorded participant sessions) | Why is this happening, and what specifically needs to change? | A decision stakeholders can act on |
Tier 1 is directional only. Net Promoter Score (NPS) tells you the relationship is degrading, CSAT tells you an interaction fell short, CES tells you friction is building, but none of them tell you why. A score alone reports customer sentiment and leaves out the reasoning underneath it.
Tier 2 turns that symptom into a business problem worth prioritizing: when NPS drops and customer churn rises in the same quarter, that's a signal worth acting on. Programs anchored only on Tier 1 routinely miss the customer retention risk sitting one layer down, and this is the layer most customer analytics programs skip.
Tier 3 is where the other two tiers become actionable, producing valuable insights the first two can't supply on their own. Recurring themes tell you what's driving customer behavior, verbatims give stakeholders language they can trace to a real person, and video closes the credibility gap that synthesized summaries leave open.
Without Tier 3, teams know satisfaction is slipping and customers are churning, but product, brand, and CX each have a different theory about why, with no evidence to resolve it. Most programs treat Tier 1 as the destination, mining customer satisfaction surveys for a headline number when it should be the first signal in a longer customer analysis.
The 4-phase interview structure behind a decision-grade finding
The single discipline that separates voice of customer analysis that changes decisions from analysis that fills a deck: write the decision before writing a single question. A vague prompt like "what do customers think about onboarding?" invites a vague answer about customer expectations in the abstract. A decision-anchored version, "should we redesign onboarding before the Q3 launch, or is the drop-off a targeting problem?", forces every interview toward evidence tied to a specific choice.
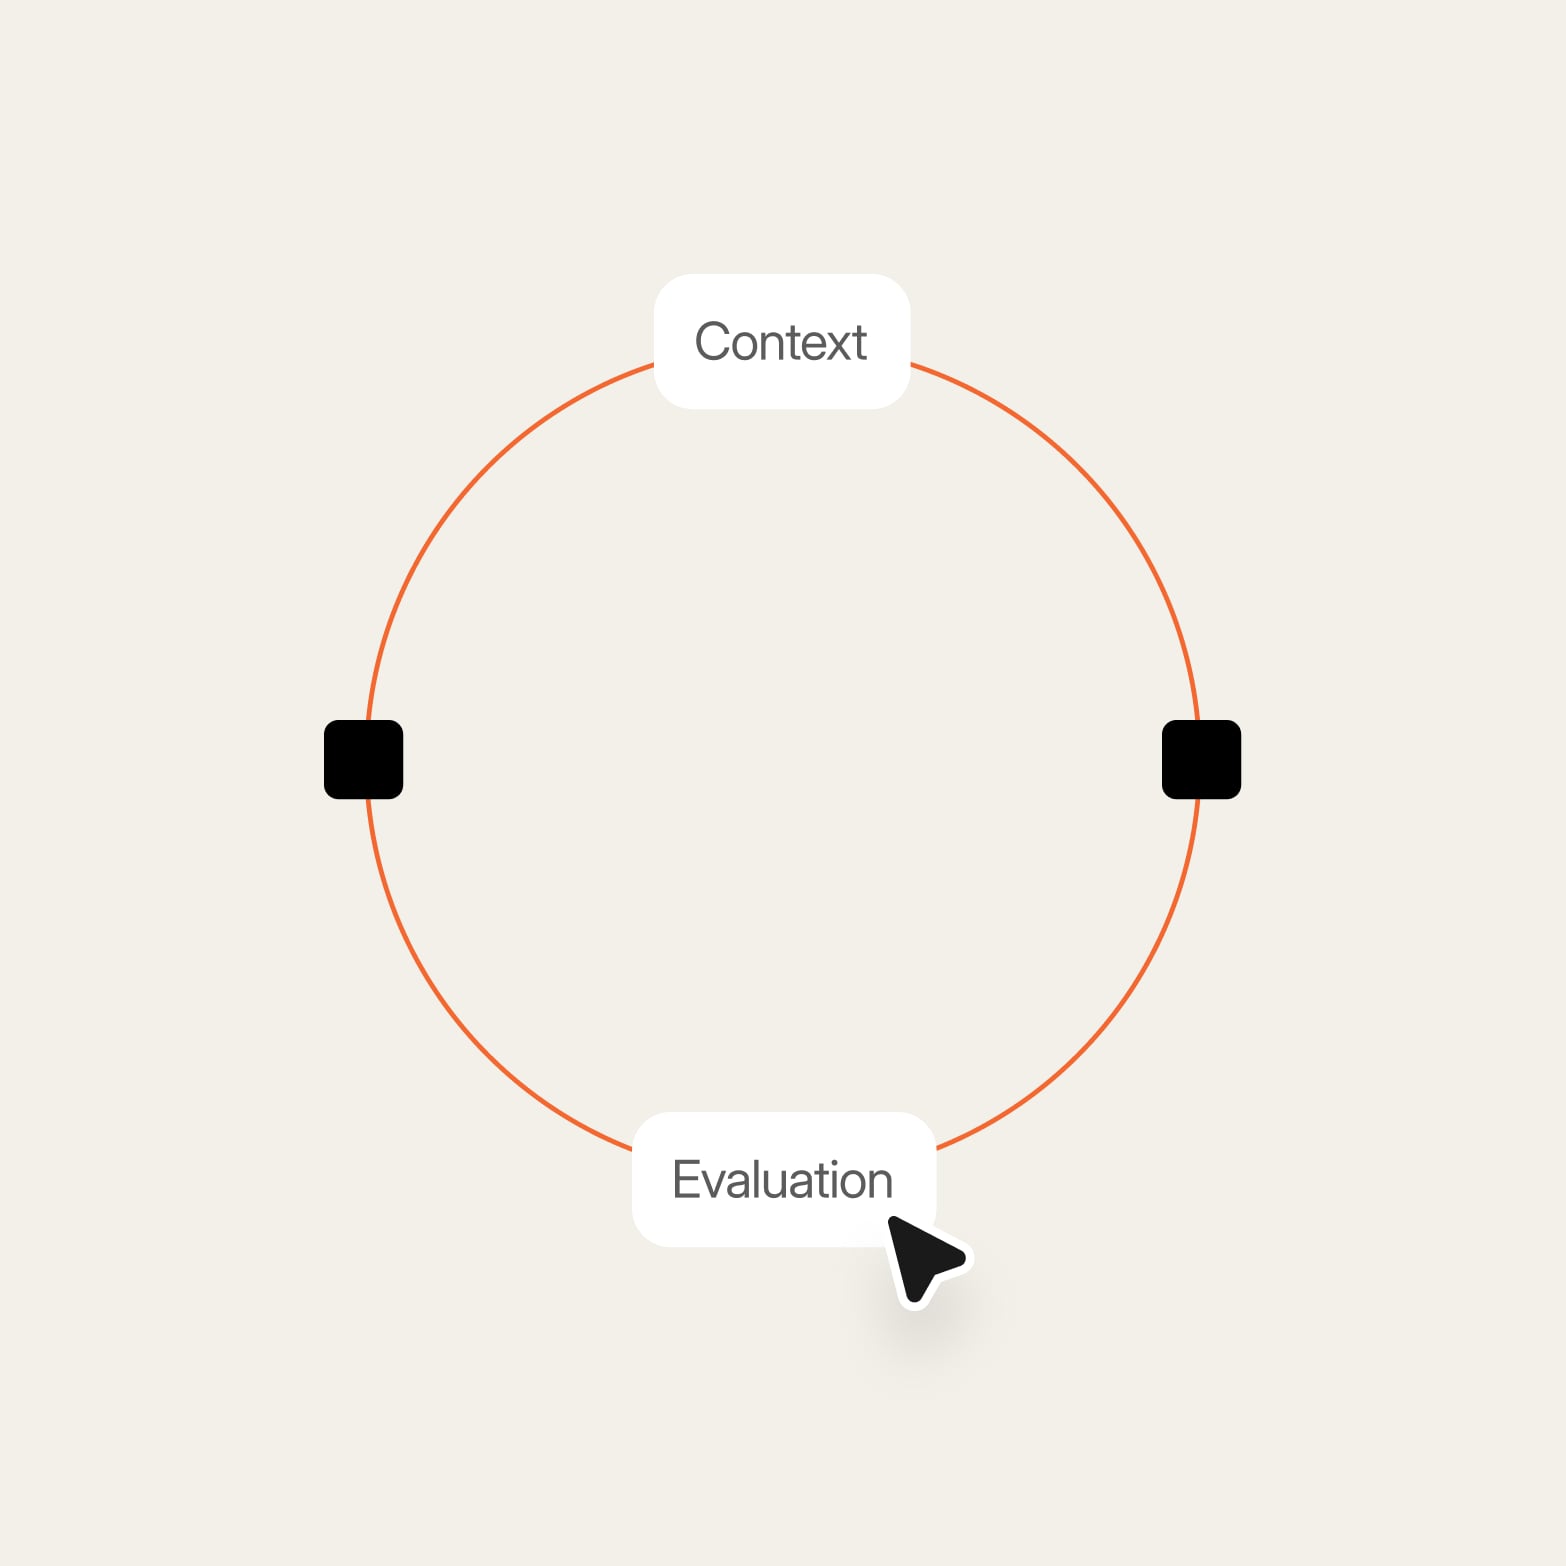
Once the decision is written, a 4-phase structure gives the interview shape:
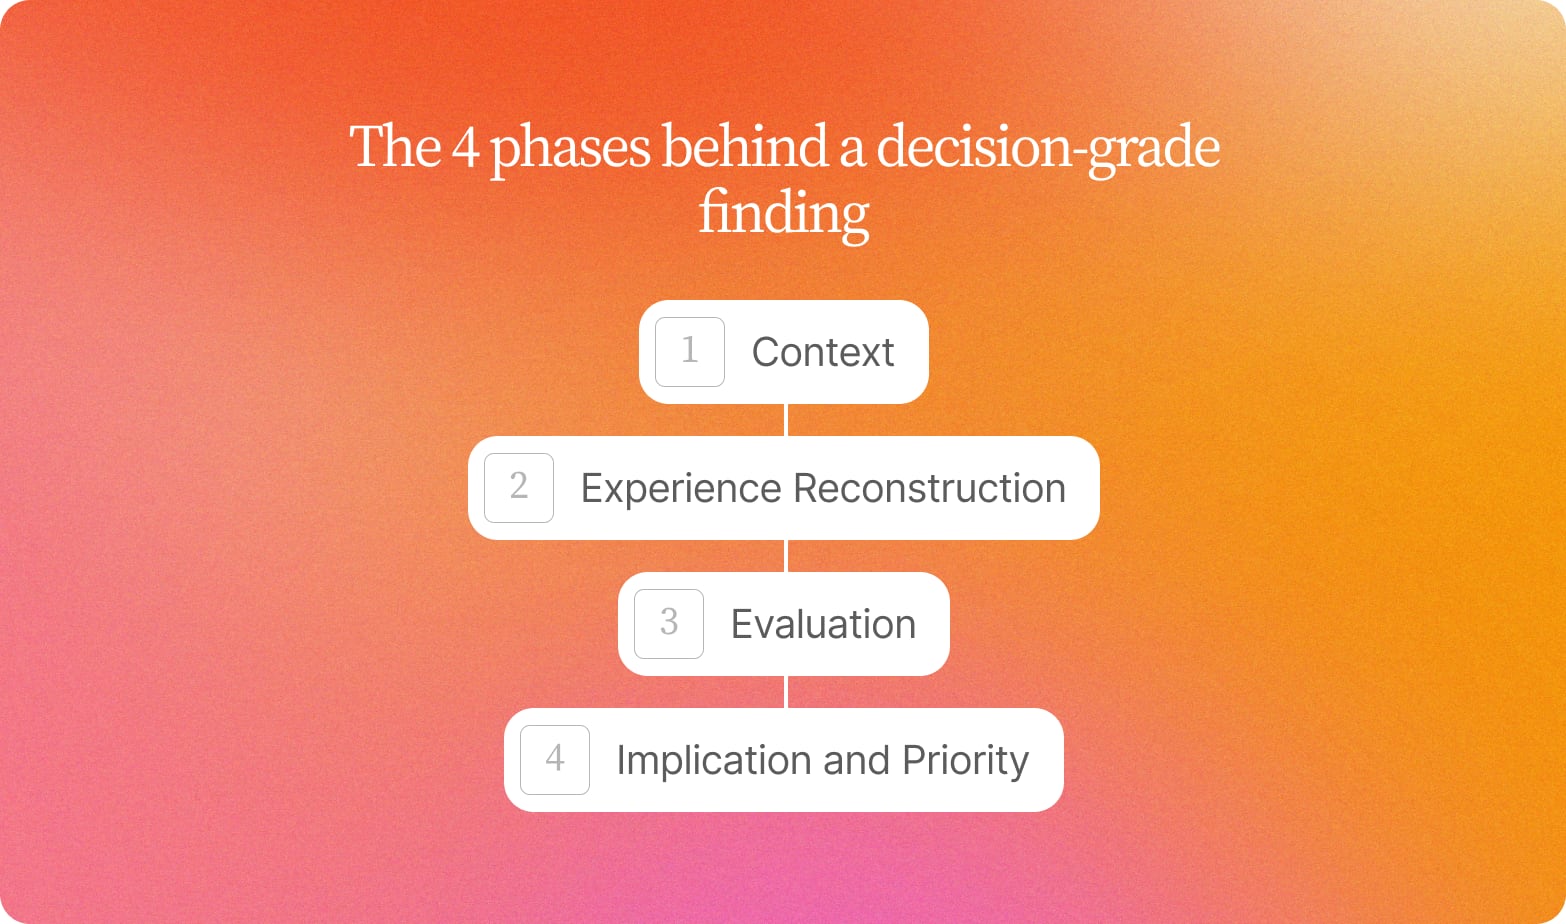
1. Context
Before a participant answers a substantive question, the interview establishes who they are and their relationship to the category. A first-week user's experience means something different from a two-year customer's, whose customer needs and customer expectations have shifted with tenure.
2. Experience reconstruction
Participants walk through a specific recent experience in chronological sequence. "Tell me about the last time you had to make this decision" surfaces behavior. "What do you generally think about X?" surfaces opinion, which is easier to collect and far less useful than the behavioral detail a well-run round of customer interviews draws out.
3. Evaluation
Structured probing on what worked, what didn't, and why. A three-layer structure keeps a moderator, human or AI, from stopping too early: a scripted question opens the topic, an adaptive follow-up responds to what the participant actually said, and a clarifying probe grounds emotional language or hesitation in something concrete. When a participant says "it was fine," a research-grade moderator asks what "fine" meant before moving on.
4. Implication and priority
Participants reflect on what would change their behavior, and how much. This converts reconstruction into decision-relevant data instead of a catalog of customer complaints.
Taxonomy consistency across studies is what compounds this over time. When the same theme codes, experience categories, and probing structure apply across every wave, findings from six months ago are directly comparable to findings from last week. Without it, each study is an island. That consistency is also what lets a team identify trends in customer preferences instead of re-discovering the same pattern every quarter.
Building a voice of the customer table stakeholders trust
A voice of the customer table consolidates themes, behavioral drivers, verbatim evidence, segment breakdowns, frequency counts, and decision implications into a single view of customer insights, turning quantitative and qualitative data into something stakeholders can read, challenge, and act on without digging through a deck.
Column structure
| Column | Purpose |
|---|---|
| Theme | The pattern or behavior being documented |
| Driver | The underlying reason participants behave that way |
| Verbatim quote | The exact words a participant used |
| Clip reference | Timestamp and participant ID linking back to the source video |
| Segment | Which audience group this applies to |
| Frequency | How many participants raised this, out of total interviewed |
| Implication | What this means for the business if left unaddressed |
| Decision | The specific action the finding recommends |
Example row
In a representative scenario from a CPG concept test:
| Theme | Driver | Verbatim quote | Segment | Frequency | Decision |
|---|---|---|---|---|---|
| Price-value disconnect at launch | Perceived ingredient cost doesn't justify premium price point | "I'd expect to pay this for something with a cleaner label, but this ingredient list reads like a budget product." | Health-conscious shoppers, 35 to 54, household income $80K+ | 11 of 18 participants in this segment | Revise on-pack claims before retail launch; test reformulated label with same segment in wave 2 |
The format works because every column does a specific job. Theme and driver separate the surface complaint from the underlying cause. Verbatim and clip reference keep the finding traceable to a real person, which is what makes it credible to a skeptical stakeholder. Segment and frequency distinguish a pattern from a one-off. Implication and decision convert understanding into action, so the table becomes the deliverable itself.
Used consistently across waves, this structure is what a successful VoC program looks like in practice: a repeatable way to transform raw feedback into decisions the business will actually act on, wave after wave. It's also what makes VoC data usable input for broader customer experience strategies, instead of a report that lives and dies in one team's inbox.
How to evaluate VoC tooling by approach
Feedback collection today spans multiple channels: social media comments, online reviews, customer service interactions, and structured interviews. No single approach covers all of them equally well, and picking the right one determines whether a VoC program surfaces signal or just noise.
| Approach | What it does well | Where it breaks down | Best fit |
|---|---|---|---|
| Survey platforms | High-volume, fast distribution; structured survey responses; net promoter score, customer satisfaction score, and customer effort score benchmarking | Captures what customers chose and leaves the why unexplored; open-text responses rarely exceed one to two sentences; no adaptive follow-up | Transactional feedback, board-level metric tracking |
| Text analytics platforms | Processes existing customer feedback at scale using sentiment analysis; surfaces recurring themes and customer sentiment from tickets, reviews, and transcripts | Dependent on feedback volume already flowing in; even with natural language processing, it reflects what was said and can miss what was meant; cannot probe hesitation or contradiction | Teams consolidating fragmented, passive feedback channels |
| AI-moderated interviews | Adaptive probing based on what participants actually say; reads tone, hesitation, and pacing across customer interactions at scale; runs conversations in parallel, from a small pilot to a full fielded wave | Requires a study design decision upfront; not suited to purely transactional, high-frequency CSAT pulses | Teams that need the qualitative data behind the number |
Survey platforms are fast but shallow: they tell you a score moved and leave out what moved it. Text analytics platforms go deeper on existing data but can't ask a follow-up question. Neither catches the hesitation before a price question or the tone shift when a competitor comes up. The right evaluation question is which approach produces findings your stakeholders will act on. None of the three approaches is a complete customer strategy on its own; most mature VoC programs blend all three depending on the type of data analysis the question requires.
Making VoC continuous instead of periodic
Most VoC programs describe a cycle: field, analyze, act, repeat. What they rarely describe is what happens between cycles: where the learning goes, and how the next study builds on what the last one established, even as customer expectations keep shifting underneath it. That gap is where institutional knowledge dies in decks, teams re-research questions they've already answered, and contradictory findings sit unresolved in separate folders. A customer program that only gets analyzed in bursts loses the compounding value continuous coverage is supposed to create.
A continuous VoC operating model requires three structural commitments most programs skip:
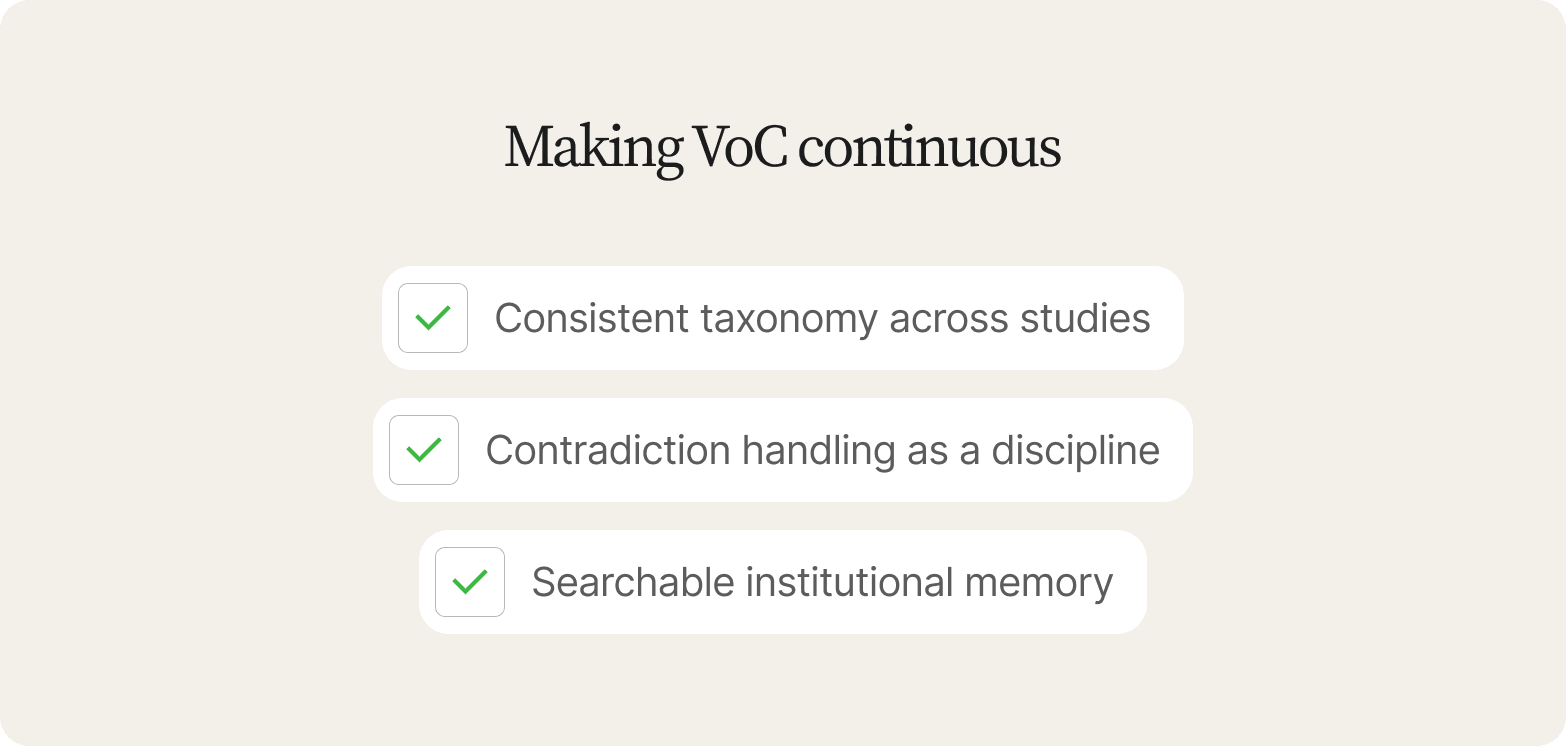
1. Consistent taxonomy across studies
Before the second study launches, the first study's themes, segments, and constructs need to be named in a way the second study can recognize. If "value perception" meant something specific in a concept test six months ago, the brand equity wave needs the same definition, or the two findings can't be compared. Without it, VoC insights and customer analytics stop compounding and start resetting to zero every quarter. A consistent taxonomy is also what lets a team collect VoC data once and reuse it across a dozen future questions, instead of collecting it again every time a new question comes up.
2. Contradiction handling as a discipline
New evidence will sometimes conflict with prior findings. Contradiction signals that something changed. The operating model needs a protocol that surfaces contradictions so they can be resolved. Customer expectations shift, and a program that treats every contradiction as noise will miss the shift until a competitor doesn't.
3. Searchable institutional memory
Findings that live in slide decks aren't searchable. A stakeholder asking "what do we know about Gen Z's relationship with our brand?" should get a sourced answer in minutes, drawing on every relevant study, including the older waves. The same applies to any question about customer perspectives across segments and waves.
This is what a searchable insight library is built for: a compounding record where every study adds to what the last one established, findings connect across waves, and every claim traces back to a real person who said it, so research keeps its value after the deck gets filed. That compounding view also lets a team see the entire customer journey, beyond the slice a single study happened to cover, and it turns VoC from a one-off audit into a discipline of continuous improvement. For teams that want continuous coverage of a specific question on top of a compounding archive of past studies, Conveo StoryLines runs wave-based research, for example, every two weeks or monthly, so a planner who notices a shift in their reporting can commission a wave without starting a new study from scratch.
4 common VoC analysis mistakes and how to avoid them
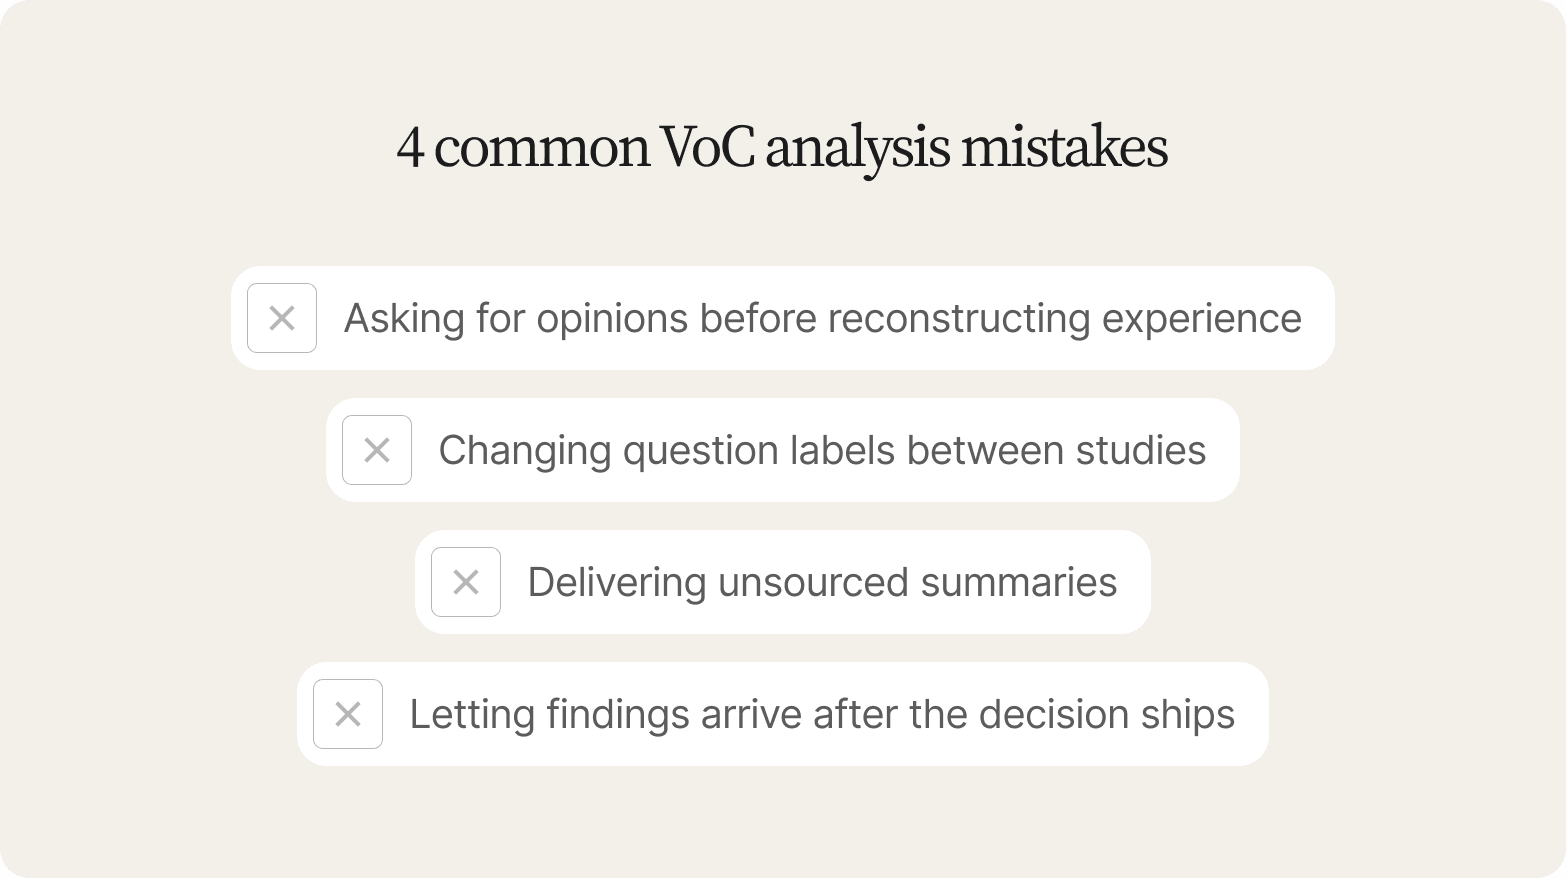
Asking for opinions before reconstructing experience. When participants are asked "what do you think of the product?" before being asked what they actually did, they reach for socially acceptable answers or repeated marketing language. Force chronology first: walk through the last session step by step before any evaluation question appears. This is where teams collect feedback that sounds insightful in a workshop and falls apart the moment someone asks for the source.
Changing question labels between studies. A theme called "onboarding friction" in Q1 and "setup difficulty" in Q2 may describe identical behavior, but the codes won't map cleanly enough to support a confident quarter-over-quarter comparison. A consistent taxonomy, maintained across studies, lets recurring issues accumulate into trackable trends instead of isolated VoC data points scattered across separate reports.
Delivering unsourced summaries. A finding that can't be traced to a specific participant, timestamp, or verbatim quote is only a claim. Stakeholders who can't verify the source won't act on it, and shouldn't. Gathering feedback is the easy part; making it traceable is what makes it usable.
Letting findings arrive after the decision ships. Analysis that lands after the product decision, campaign brief, or budget cycle closes doesn't inform anything. It confirms what was already guessed, at full cost. A feedback loop that closes after the decision is a postmortem.
Relying on a single customer platform or tool to catch everything is itself a mistake: no survey, text analytics tool, or AI-moderated interview covers every failure mode alone.
Where Conveo fits in a severity-weighted VoC program
Insights teams at Google, Canva, Unilever, and AB InBev use Conveo to run the interview structure above without the operational drag that usually stretches it across weeks. Recruitment runs through Conveo's integrated panel network, spanning 8 integrated panel providers, or a team's own list via CSV upload, with behavioral screening at recruitment filtering for the profiles that actually matter, so feedback requests reach people who can actually speak to the decision at hand. The goal is to find consumer pain points that would otherwise surface only after a concept has shipped or a launch decision has been made.
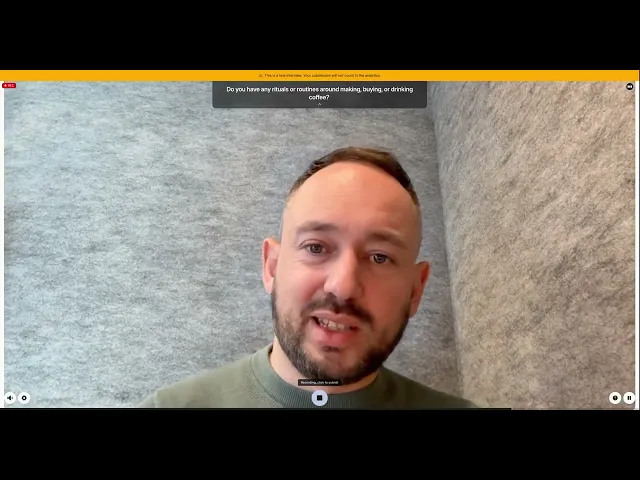
Conveo's AI research assistant runs conversations at scale, across 50+ languages, probing adaptively based on what a participant says, and reads tone, hesitation, and pacing alongside speech, including facial cues, in native Conveo interviews. Every theme connects to a verbatim quote, participant ID, timestamp, and video clip, and every study adds to the searchable insight library described above, so a complaint that surfaced last quarter and resurfaces this month becomes a trackable theme instead of a coincidence discovered too late. Conveo can field 100 interviews in 3 days, and removing that operational drag leaves the rigor researchers build into the study design intact. Research and insights teams get the rigor they would build into a human-moderated study, at a pace that keeps up with how fast a category moves. Done well, this is how a brand or concept decision gets the evidence it needs before the launch date.
"Even if you're doing dozens of in-depth interviews, multiple focus groups, you get those interesting nuggets and insights. But then you take them to the client and there's always a sense of: is this really a trend? It's very hard to validate, and very hard to demonstrate the difference between an important trend and a one-off anomaly."
Fergus Navaratnam-Blair, VP Trends and Futures, NRG
See it in action in How AI-Moderated Video Interviews Actually Work:
Frequently asked questions
What is AI-moderated qualitative research?
AI-moderated qualitative research is a method in which an AI research assistant conducts conversational interviews with participants at scale, following a researcher-designed discussion guide and probing adaptively based on what each participant says. The researcher still designs the study, frames the hypotheses, and interprets the findings into valuable insights; the AI research assistant handles the moderation and initial synthesis across many customer interviews simultaneously.
How is AI-moderated research different from a survey?
Surveys ask fixed questions in a fixed order; every participant gets the same experience regardless of what they say. AI-moderated interviews adapt in real time: when a participant gives a vague answer, the AI research assistant probes; when they mention something unexpected, it follows that thread. That adaptive dynamic is why participants tend to share richer, more detailed responses than those collected through static customer surveys. Surveys are still a reasonable way to collect customer feedback and run customer satisfaction surveys at volume. For understanding why a score moved, use interviews.
Can AI-moderated interviews replace human researchers?
No. AI moderation handles the operational work: running conversations in parallel, probing consistently across participants, transcribing and synthesizing at scale. Human judgment stays essential for study design, hypothesis framing, interpreting findings in a business context, and communicating implications to stakeholders. Teams that use AI moderation to extend what their researchers can cover get better outputs than teams that treat it as a way to remove the researcher. The same logic applies to customer relationships more broadly: the goal is to augment the people who own them and the judgment those relationships depend on.
How do you ensure the quality of AI-moderated research findings?
Quality depends on the rigor of the study design and the traceability of the outputs. How sophisticated the analytics tools look in a demo tells you little. A dashboard that claims to auto-generate actionable insights from qualitative feedback is only as good as the verbatim evidence backing each one up. Every finding should connect back to a real participant, with verbatim quotes and video available to verify. The question to ask of any AI-moderated research platform is whether the findings are traceable, the method is transparent, and a researcher with professional accountability would stand behind the output.
How do you weight severity against frequency in practice?
Severity weighting keeps frequency and adds a second dimension next to it. A theme mentioned by three participants with visible hesitation and a longer-than-average response can outrank a theme mentioned by thirty who were simply answering the question asked. Keeping frequency and severity in separate columns of a voice of the customer table, rather than collapsing them into one score, forces the team to make that judgment explicitly so a high count can't quietly override a high-stakes signal.

About the author
Hendrik Van Hove
Founder & CPO
Hendrik is Conveo’s Chief Product Officer and co-founder. He's extremely passionate about technology and the real positive impact it can bring. Before Conveo, he ran AI strategy projects at McKinsey for the Fortune 2000, working with boards and every function from marketing, to sales to insights.
More by Hendrik →Qualitative insights at the speed of your business.
Conveo runs AI-moderated video interviews and structures everything they say.