

Metrics
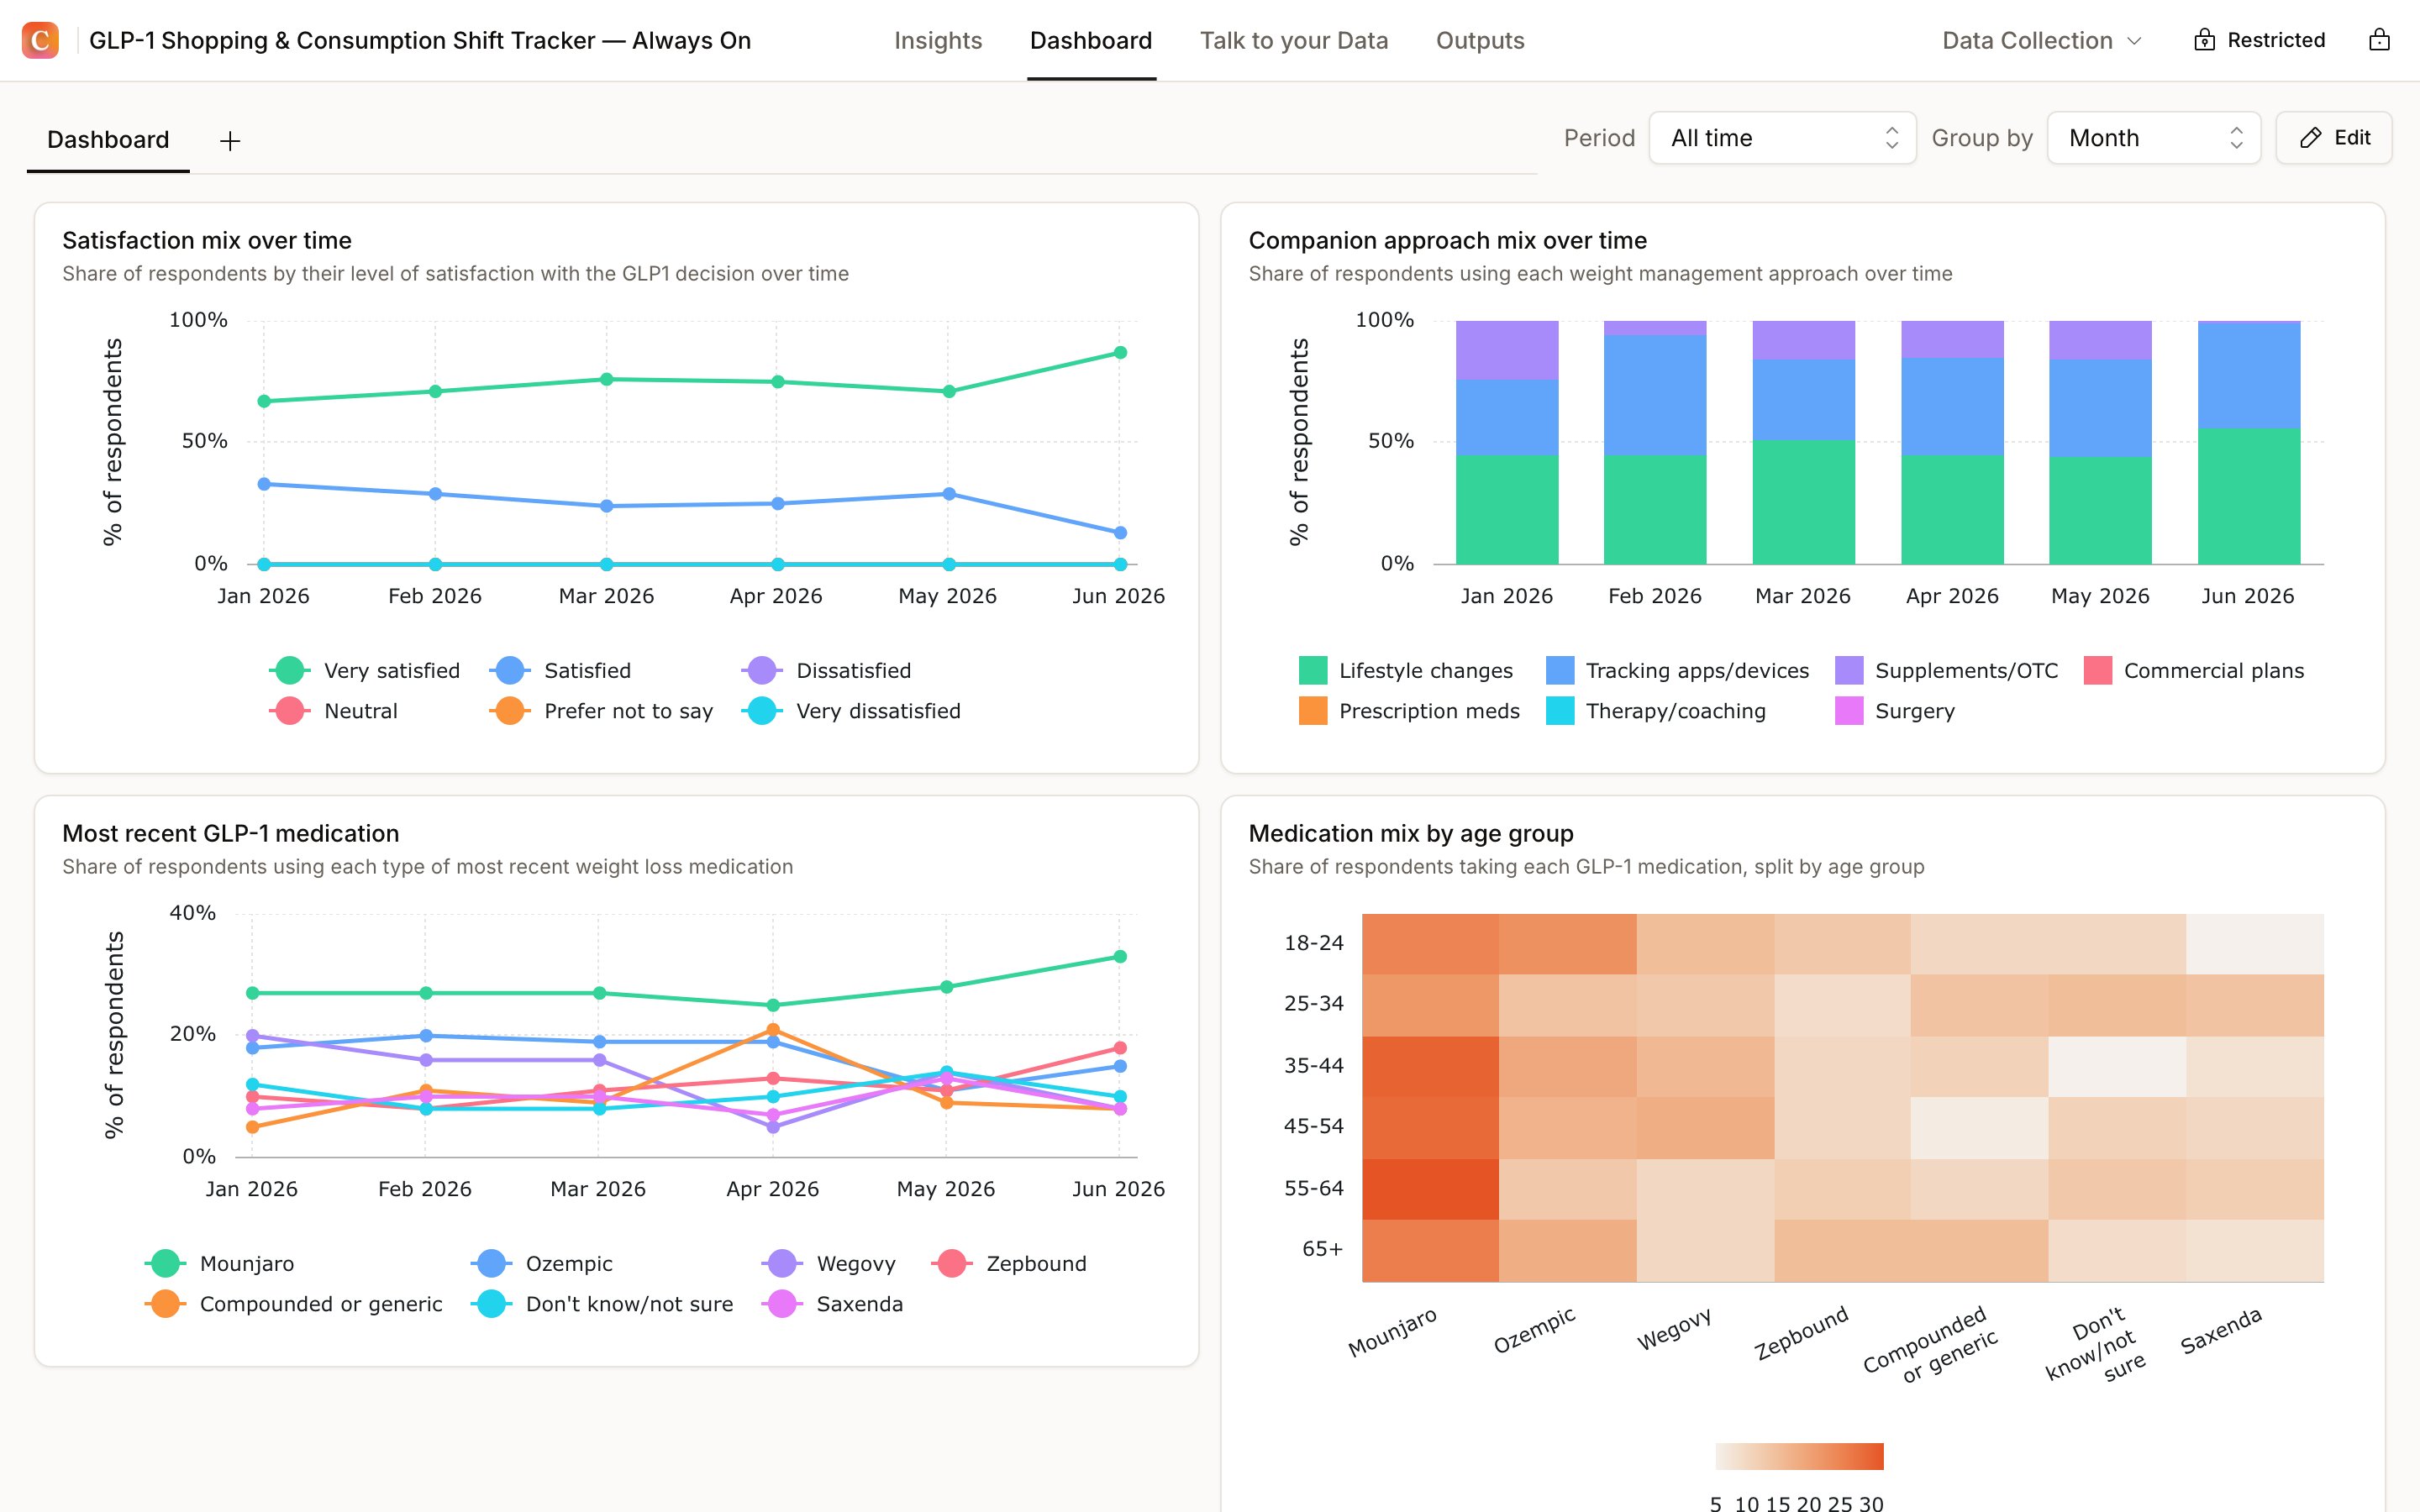
A chart uses an available analysis measure or category, called a facet in the chart builder. Examples include a coded topic or a numeric answer. Select the values you want to track, then choose a visualization. Open Dashboard, choose Edit, then Add card manually to open New chart. Configure the measure, visualization, optional grouping or split, and optional audience filter. Choose Add to dashboard, then Done when you finish arranging the board. Changing the dashboard requires edit access to the underlying study.Choose the population and measure
Both populations exclude test, hidden, and deleted interviews. All participants also excludes simulated interviews. Talk to your Data uses completed interviews, so it does not provide the same all-participant recruitment view.
Switching the population can change both the count and the period an interview appears in. Use the same population when comparing charts.